Отчёты позволяют работать с актуальными данными из нескольких таблиц на одной странице. Вы можете объединить ключевые задачи и вехи в общую сводку для заинтересованных лиц или создать разнообразные представления для различных инициатив.
Если обновить данные в отчёте, соответствующие таблицы тоже автоматически обновятся, и наоборот. Можно создать строчный отчёт по строкам и столбцам таблицы или сводный отчёт по полям сводок.
Благодаря группированию и сводкам в отчётах можно быстро объединять данные из разных таблиц и выполнять вычисления.
Вы можете легко делиться отчётами с пользователями, имеющими доступ к таблицам, данные из которых используются в отчётах. Отчёты можно публиковать или отображать на панели мониторинга, чтобы представлять аудитории только информацию общего характера без доступа к исходным данным.

Типы отчётов
В отчётах можно объединять информацию из нескольких таблиц и отображать только те элементы, которые соответствуют указанным критериям.
Вы можете создавать отчёты двух видов: по строкам и по сводкам таблиц.
- Отчёты по строкам позволяют собирать данные строк из нескольких таблиц. Например, вы можете создать на базе нескольких таблиц отчёт со всеми назначенными вам незавершёнными задачами, имеющими высокий приоритет.
- В сводных отчётах по таблицам можно отображать сводные данные из нескольких таблиц. Сводные отчёты по таблицам позволяют просмотреть состояние нескольких проектов или отобразить метрики на уровне портфеля на панели мониторинга. Дополнительные сведения о создании сводных отчётов по таблицам см. в статье Создание представления портфеля с помощью сводного отчёта по таблицам.
Как и в случае с таблицей, вы можете отправлять и публиковать отчёт, а также предоставлять к нему общий доступ. Также можно редактировать данные в отчёте, подводить по ним итоги, группировать и сортировать их. Обратите внимание: отчёт отличается от таблицы тем, что в нём не хранится информация (он лишь отображает данные, которые хранятся в таблицах). Из-за этого различия отчёты не учитываются в общем количестве таблиц для вашей учётной записи.
Создание отчёта по строкам
С помощью отчёта по строкам можно:
- создавать фильтры для актуальной информации в таблице;
- разрешать пользователям редактировать только важные столбцы или строки;
- объединять информацию из нескольких таблиц в одном отчёте.
Существует два типа отчётов:
- Отчёт по строкам: добавление строк из нескольких таблиц в один отчёт.
- Сводный отчёт по таблицам: добавление сводок по нескольким таблицам в один отчёт.
Сведения о создании сводного отчёта по таблицам см. в статье Создание представления портфеля с помощью сводного отчёта по таблицам.
Создание отчёта по строкам
- В строке Меню слева выберите Центр решений
 .
. - Затем нажмите Создать > Отчёт.
- Создайте отчёт по строкам. Он появится в папке с таблицами.
Настройка отчёта
Настроить информацию, которая будет добавлена в отчёт, можно на этих вкладках:
- Исходные таблицы: выбор таблиц с необходимыми данными для отчёта.
- Отображаемые столбцы: выбор столбцов, которые будут добавлены в отчёт из исходных таблиц.
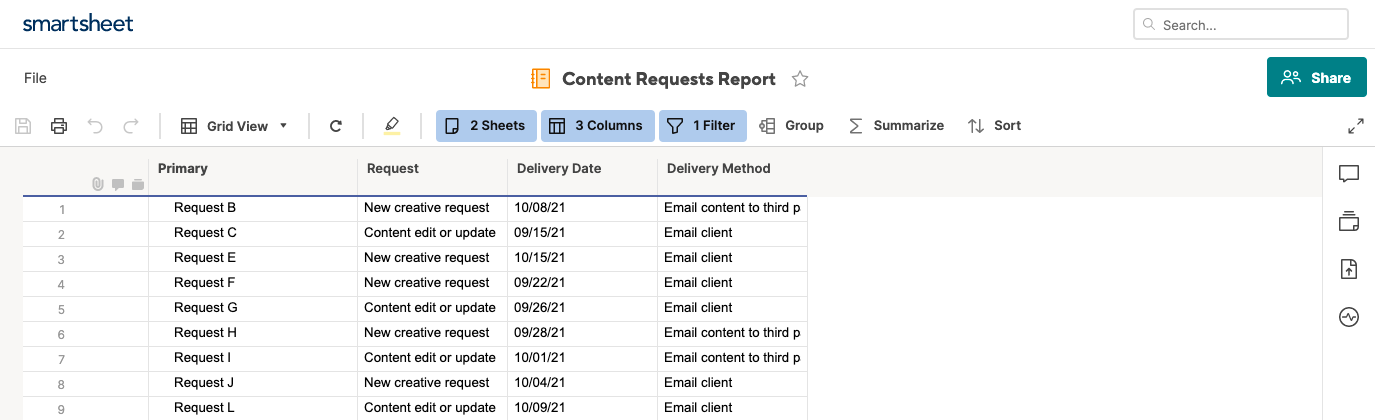
- Условия фильтра: выбор данных, которые будут добавлены в отчёт из исходных таблиц.
Фильтр показывает запросы, которые будут отправлены по электронной почте.
- Группа: категории облегчают доступ к необходимой информации.
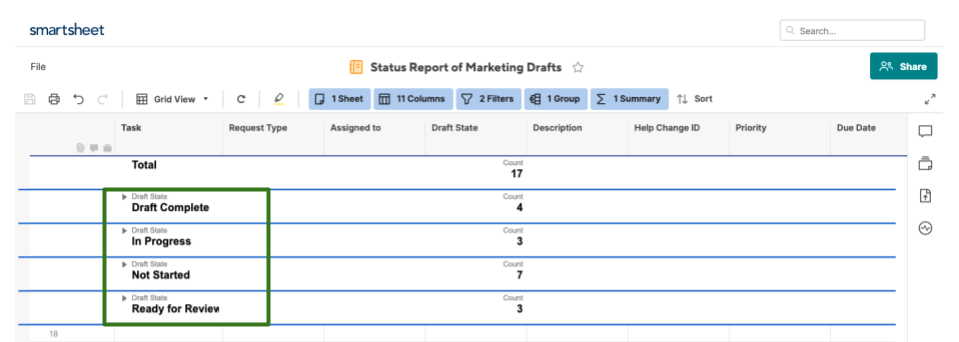
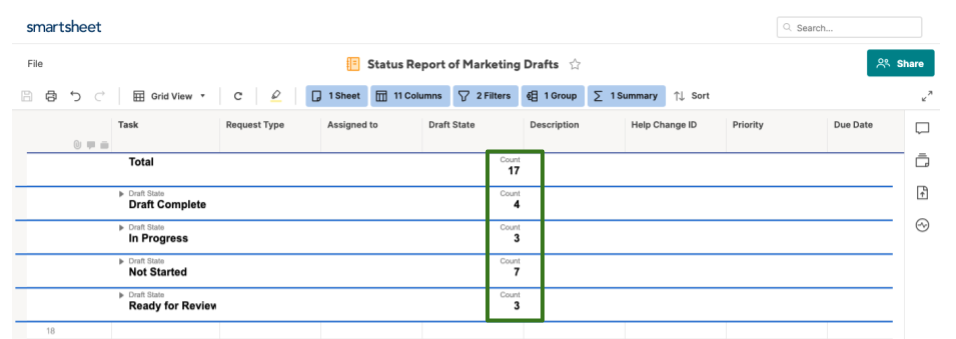
- Сводные данные: определение ключевых метрик, которые помогут вам принимать обоснованные решения.
Информацию также можно обобщать в зависимости от статуса.
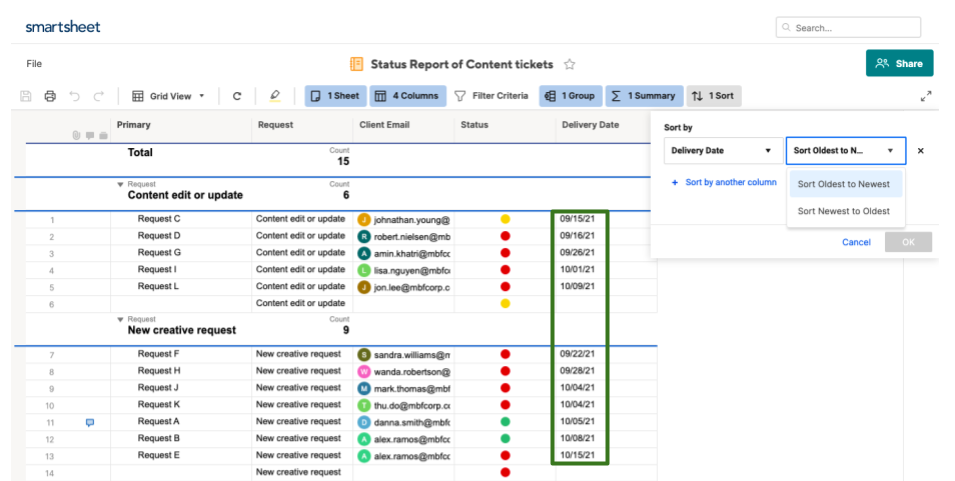
- Сортировка: отображение информации в определённом порядке.
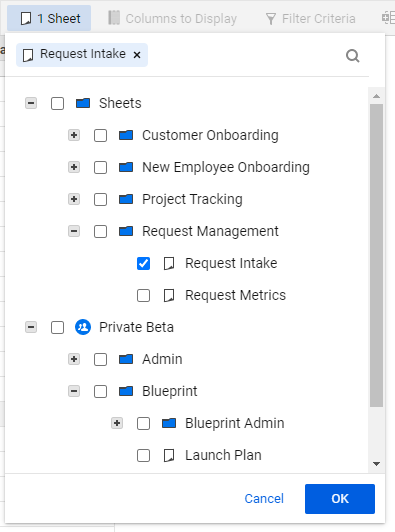
Выберите исходные таблицы для Построителя отчётов
Нажмите кнопку "Исходные таблицы", чтобы выбрать таблицы, папки и рабочие пространства, которые нужно включить в отчёт. В этом списке отображаются таблицы, которые вы создали или к которым вам предоставлен доступ. Для поиска конкретных таблиц используйте прокрутку или введите имя таблицы в поле поиска.
Чтобы автоматически включать в отчёт новые таблицы, можно создать его на основе всего рабочего пространства. При добавлении новой таблицы в рабочее пространство она автоматически будет добавляться в отчёт. Подробнее о рабочих пространствах можно узнать в справочной статье Управление элементами в рабочем пространстве.
Необходимо учитывать изложенные ниже моменты.
- Чтобы перейти к следующим параметрам (отображаемые столбцы, условия фильтра, группа, сводные данные, сортировка) в Построителе отчётов, необходимо выбрать хотя бы одну таблицу, папку или рабочее пространство на вкладке таблицы.
- Если вы выберете папку, новые таблицы, добавленные в неё после этого, не будут включаться в отчёт. Чтобы включить в него добавленные таблицы, удалите папку с вкладки таблицы и добавьте её снова.
- Форматирование (цвет шрифта в ячейках, цвет фона, полужирное начертание и т. д.) в отчёте зависит от форматирования в исходной таблице.
- Иерархии строк исходной таблицы в отчётах не отображаются.
- Вносить изменения в ячейки с формулами с помощью отчёта нельзя.
Если для таблицы включены зависимости:
- Из отчёта нельзя изменить даты окончания для её строк, так как они рассчитываются автоматически на основе параметров зависимостей. Вместо этого вы можете изменить дату начала и длительность в строке, чтобы автоматически рассчитать новую дату окончания.
- Из отчёта нельзя изменить дату начала задачи, связанной с предшественником. Вместо этого вы можете изменить дату начала или длительность предшествующей задачи, чтобы автоматически рассчитать даты для зависимых задач.