С помощью отчёта по строкам можно:
- создавать фильтры для актуальной информации в таблице;
- разрешать пользователям редактировать только важные столбцы или строки;
- объединять информацию из нескольких таблиц в одном отчёте.
Существует два типа отчётов:
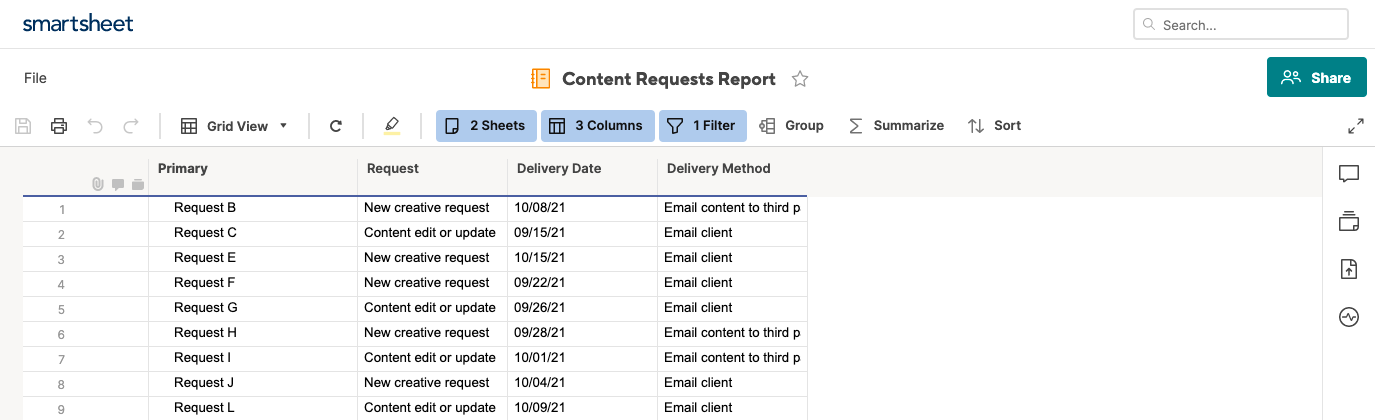
- Отчёт по строкам: добавление строк из нескольких таблиц в один отчёт.
- Сводный отчёт по таблицам: добавление сводок по нескольким таблицам в один отчёт.
Сведения о создании сводного отчёта по таблицам см. в статье Создание представления портфеля с помощью сводного отчёта по таблицам.
Создание отчёта по строкам
- В строке Меню слева выберите Центр решений
 .
. - Затем нажмите Создать > Отчёт.
- Создайте отчёт по строкам. Он появится в папке с таблицами.
Настройка отчёта
Настроить информацию, которая будет добавлена в отчёт, можно на этих вкладках:
- Исходные таблицы: выбор таблиц с необходимыми данными для отчёта.
- Отображаемые столбцы: выбор столбцов, которые будут добавлены в отчёт из исходных таблиц.
- Условия фильтра: выбор данных, которые будут добавлены в отчёт из исходных таблиц.
Фильтр показывает запросы, которые будут отправлены по электронной почте.
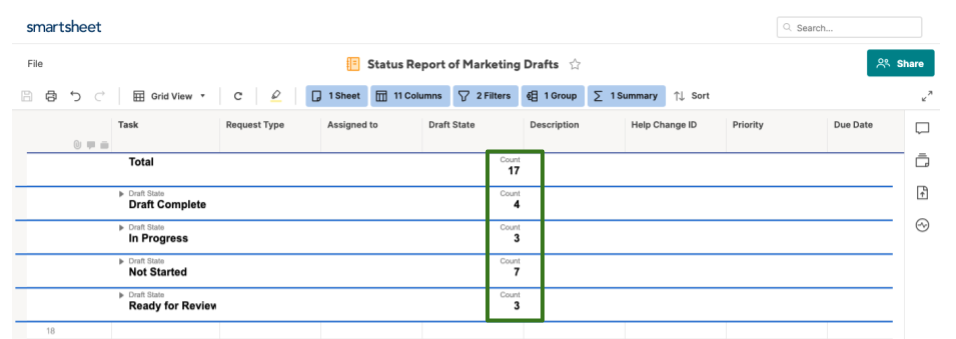
- Группа: категории облегчают доступ к необходимой информации.
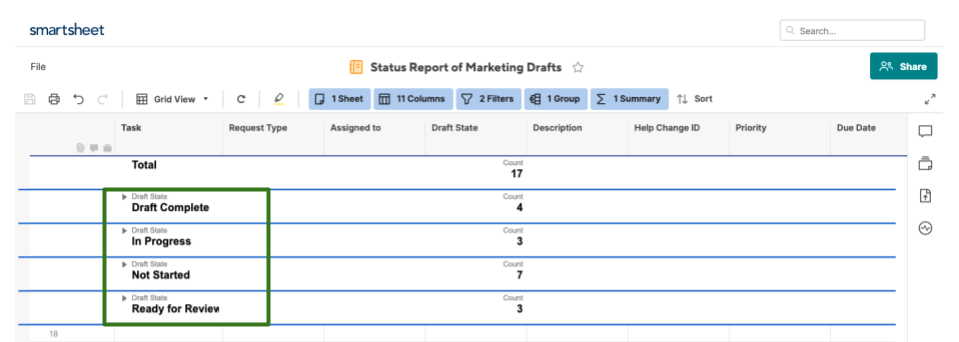
- Сводные данные: определение ключевых метрик, которые помогут вам принимать обоснованные решения.
Информацию также можно обобщать в зависимости от статуса.
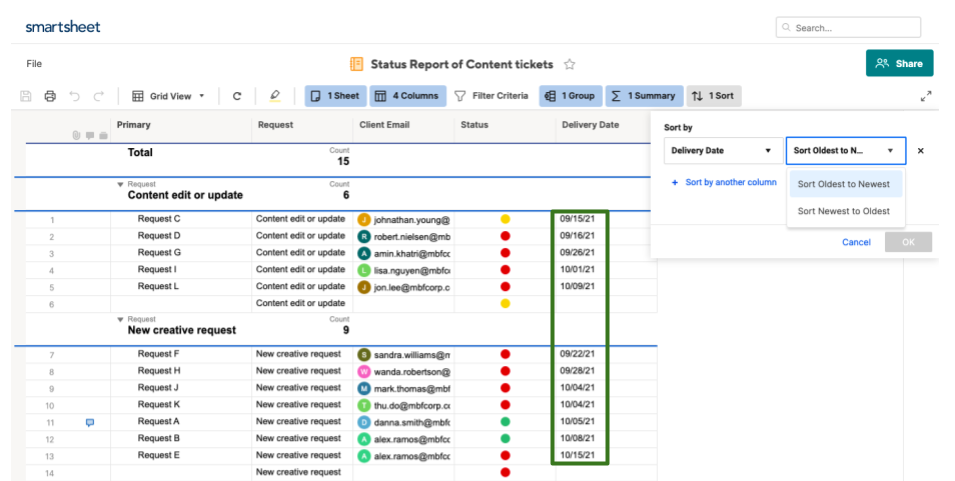
- Сортировка: отображение информации в определённом порядке.