Follow these step-by-step instructions to create a Gantt chart.
Add dependencies to your Gantt charts to efficiently manage your project timeline and the relationships between individual tasks. When the start or end date of a predecessor task changes, the dates of dependent tasks in your timeline will automatically update to reflect the change. You can also set up baselines to track the variance between your plan vs. actual dates.
Video MP4
Create and work with a Gantt view
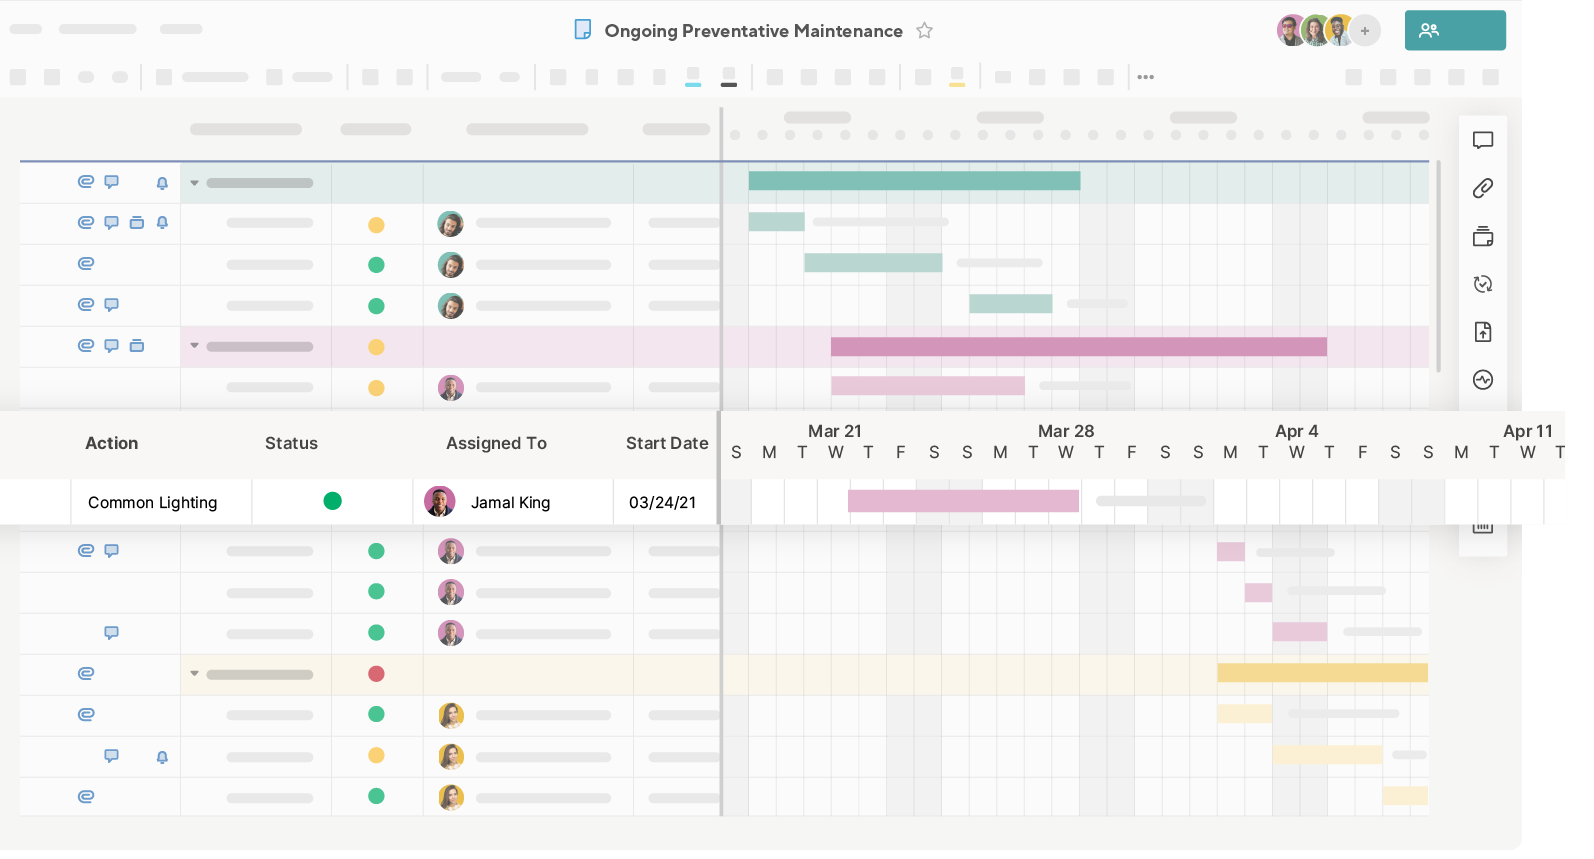
Gantt view is a user-friendly way to visualize your project schedule, split into two parts:
- On the left, the grid view lays out your project tasks and details.
- On the right, the Gantt chart outlines your tasks and milestones as horizontal bars and diamonds, aligned chronologically from left to right. Each bar represents the duration of a task, making it easy to see how tasks align and overlap at a glance.
Gantt view also allows you to:
- View dependencies and track the relationship between tasks.
- View your project's critical path.
- Display the % Complete of your tasks.
- Use hierarchy to create summary rows of your project’s details.
Brandfolder Image
Add a Gantt view
To use Gantt view, your sheet or report must have at least two date columns (not backed by column formulas). The length of a taskbar represents the duration between these dates.
In the toolbar, select Gantt view to switch your view. The chart appears to the right of your sheet’s columns. There is also a divider that separates the grid columns from the Gantt chart. You can widen the display of either section by hovering over the divider and dragging the divider to the right or left.
Gantt view draws a:
- Single-day bar for rows where the start date and end date are the same.
- Multi-day bar for rows where the start date and end date are different.
- Milestone diamond for rows where only the start OR end date is provided.
If dependencies are enabled in your sheet, milestone diamonds are drawn for any rows with a zero-day duration.
Configure your Gantt view settings
Only the sheet's Owner and Admin can modify Project Settings.
Modify your sheet’s Project Settings to configure your Gantt view’s settings and enable dependencies.
To open Project Settings, right-click any column header in the Gantt view and select Edit Project Settings, or select the settings toolbar button in the top right corner of the sheet.
Visualize % complete
You can choose to display a %complete overlay. Choose which column to display the % complete overlay by configuring a % Complete column in Project Settings. Any time you enter a value in this column, you’ll see a shaded bar within the taskbar per the values you entered in the % complete column.
Adjust the Gantt view timescale
This determines the primary and secondary headings in the Gantt view timescale. To modify the headers, select the gear icon in the upper right-hand corner of the Gantt chart and select Gantt Timescale Settings in the Projects Settings dialog.
Use Gantt View
Adjust the Gantt view timescale
The Gantt view has four zoom levels: quarter, month, week, and day. Use the Zoom In or Zoom Out icons to adjust the view.
Save any changes made to the Gantt view timescale display to preserve them during export. These changes appear when exported.
Modify tasks directly from the Gantt view
To change the dates of your task:
- Select and drag the center of a taskbar to move the task to new start and end dates.
- Drag just the start or the end of the bar to change its start or end date (and the resulting duration).
Customize your task bars
You can apply color to the taskbars. To add color:
- Right-click on a taskbar.
- Select Color Settings.
You can also apply color to taskbars automatically by using conditional formatting.
Row hierarchies
You can use row hierarchies in the grid portion of the Gantt view to organize rows into sections or phases. Child rows are displayed as individual task bars in the Gantt chart based on their start and end dates.
If you use hierarchies and turn on dependencies on the sheet, parent rows reflect a summary of their child rows. The parent row values are calculated automatically in the Duration, % Complete, Start Date, and End Date columns; they can't be modified manually. However, if dependencies are off, you can change the parent row values as needed.
Critical path, summary, and driving paths
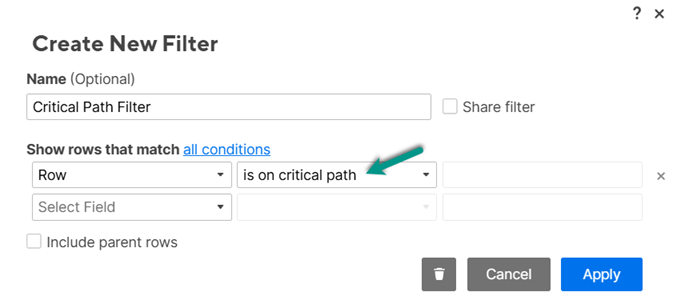
You can use the critical path, which is the longest sequence of tasks that must be completed on time to stay on schedule and avoid delays. Enable dependencies in your sheet’s Project Settings to use the critical path. Once the critical path is enabled, you can create a filter to view only tasks that are or are not on the critical path.
Brandfolder Image
You can also enable the driving path to identify tasks that affect your task’s start date quickly. Additionally, you can activate the summary path to identify the subtasks impacting the end date of their parent summary task.
Use baselines
Use baselines to compare a project’s scheduled times against actual completion. To enable baselines:
- Add Start Date and End Date columns.
- Switch to Gantt View, then select the Baselines button in the toolbar.
Follow these step-by-step instructions to enable dependencies on your Gantt chart.
Follow these step-by-step instructions to set up your working days on a project sheet.
Follow these instructions to set up baselines on your project sheet.

