Now that you've built a project sheet and RAID log, it's time to harness dashboards to provide real-time insights into your project. Learn to create dynamic dashboards that help monitor project progress and make informed decisions.
You can use the Project Dashboard in the Simple Project Plan template as a starting point.
Create and edit a Smartsheet dashboard
You must have sharing permissions to the source sheet or report to add data to chart, metric, and report widgets.
Create a new dashboard
- On the Home screen, you can create a new dashboard by either selecting the Start a new project, program or process button or the + icon on the left rail.
- Select Dashboard.
- Type a name for your dashboard, and then select OK.
- Select Edit Dashboard
Brandfolder Image
 to edit and add information to your new dashboard.
 - Add the appropriate dashboard widgets.
- In the upper-right area of the dashboard, select Save.
Edit a dashboard
If you're the dashboard's Owner or Admin, you can change its background color and add or edit a widget. You can also access extra editing features from the shortcut menu.
To edit your dashboard
- In the upper-right area of the screen, select Edit Dashboard
Brandfolder Image
.
- On the right navigation bar, select any of these panes:
- Dashboard theme: Select a color theme for the entire dashboard and apply it to all your widgets. You also can customize the canvas color.
Theme colors don’t apply to content within report and web content widgets.
- Add Widgets: Add the widgets you want to appear on your dashboard.
- Widget Settings: Edit a widget on your dashboard.
- Once you're done with your edits, select Save in the upper-right area of the screen.
Need more information about adding and editing dashboard widgets? Read the Add and Edit Widgets on Your Dashboard article.
Use the shortcut menu to edit your dashboard
Right-click anywhere on the grid, and then select any of these actions:
- Paste Here: Paste a widget you copied.
- Dashboard Settings: Change the background color or font.
- Add Widget: Add widgets to your dashboard.
- Consolidate Empty Space: Delete unused rows between top and bottom widgets to consolidate a dashboard's vertical space. This presents the most compact version of the current dashboard without affecting how the widgets are arranged.
Image widgets on your dashboard
You can drag images from a folder on your computer directly to the dashboard. When you drop the image, Smartsheet creates an image widget for you. You can also create the widget and then drag the image onto it.
Hover over the image widget to change an image via the file selector.
Layout
- Fill: Default. The image keeps its aspect ratio and fills the widget container. The image appears clipped to fit.
- Fit: The image keeps its aspect ratio but is resized to fit within the widget container.
- Actual: The image displays the actual size.
Margins
- No margin: Default
- With margin: 20px
Apply custom colors
When selecting colors for fonts, charts, titles, and more, you can choose from standard presets or add a custom color using a HEX code, an RGB code, or a color gradient.
To create a custom color
- Select Edit > Dashboard theme in the dashboard's top right corner.
- Under Dashboard color or Widget color, select Change, and then select the plus icon.
- Pick a color or enter the hexadecimal color value.
- Select Add.
What you should know about custom colors
- You can save up to 20 custom colors on a dashboard.
- Custom colors are unique to the dashboard; the setting doesn’t apply to other dashboards. You can quickly select the same custom color on different widgets if they’re on the same dashboard.
- Start a new dashboard from your current one to keep the custom colors and other items in it. To create a copy of the dashboard, select File > Save as New.
- When viewing a dashboard in the mobile app, custom colors are replaced by the closest available default colors.
Automatic refresh on dashboards
A published dashboard automatically refreshes every 10 minutes. You can’t customize or turn off this behavior.
You can only change the Auto-Refresh feature for your view of the dashboard. For example, if you turn off Auto-Refresh, it remains enabled for other collaborators who are viewing the dashboard.
To change the frequency or to turn off the Auto-Refresh feature
- In the menu bar, select View >Auto-Refresh.
- Select the change you'd like to apply:
- Select your frequency.
- To turn off the Auto-Refresh feature, select Off.
Web Content Widgets don't automatically refresh on dashboards.
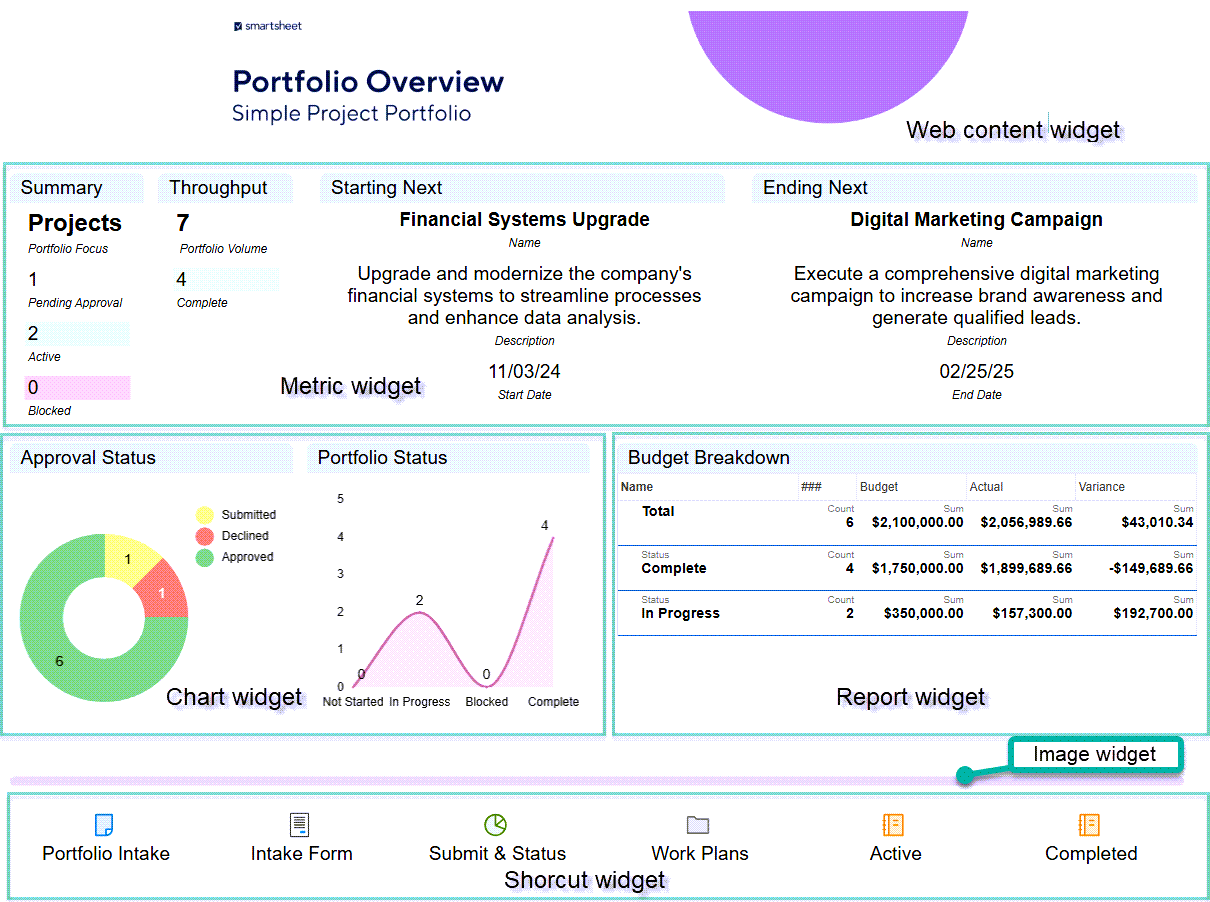
Widgets for Smartsheet Dashboards
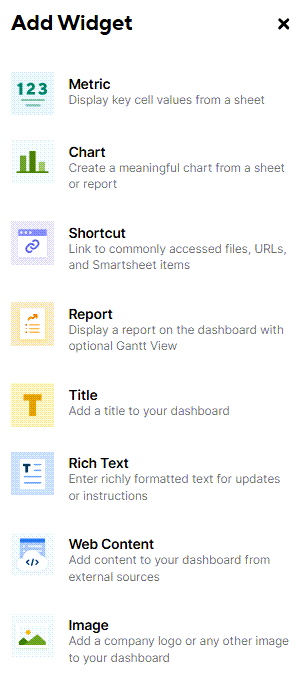
The Add Widget panel provides a brief description of each widget's function.
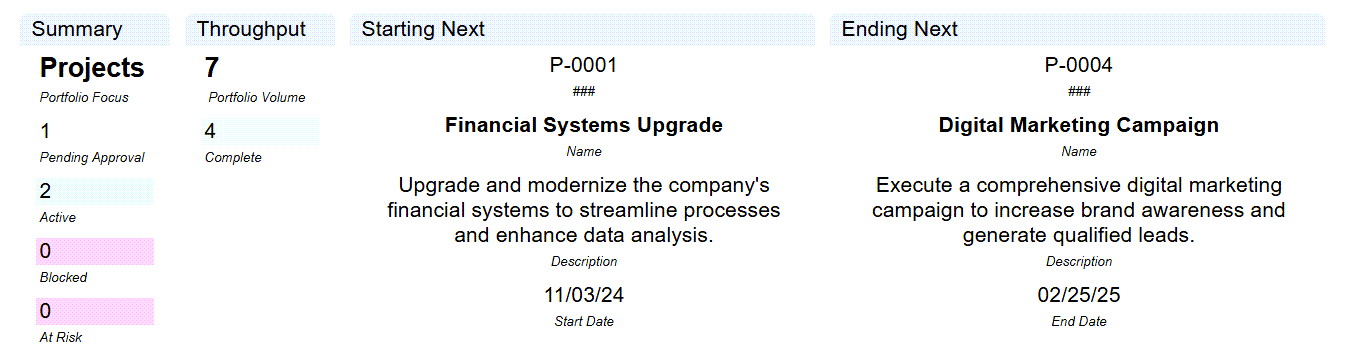
Use the metric widget to display content from one or more cells in a sheet. You need at least Editor permissions on the source sheet from which you want to display information.
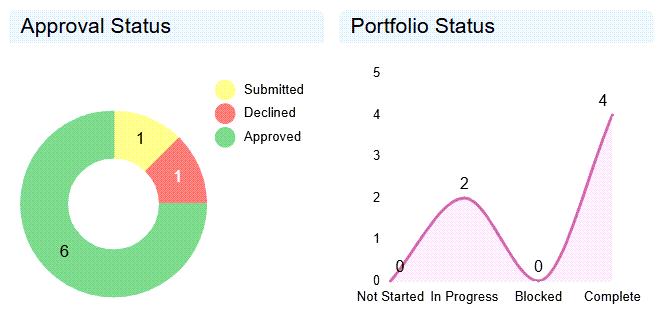
The chart widget displays real-time data in a dashboard from a table on your sheet. You need at least Editor permissions on the source sheet from which you want to display information. Several chart types are available:
- Line
- Smooth line
- Stepped line
- Bar
- Stacked bar
- Colum
- Stacked column
- Pie
- Donut
- Scatter
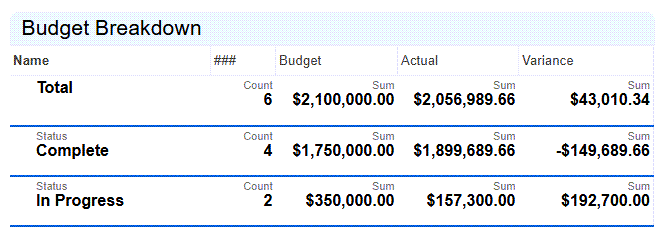
Explore the one that best suits your needs. Here is an example of a couple of them:
With the shortcut widget, create a link or a list of links to specific URLs, files, or Smartsheet items.

Add any text string you want to use for titles, instructions, updates, or any other type of text.
This widget allows you to display a report in your dashboard, but you need at least Admin access to the source report. Users shared to the dashboard don't always need access to the underlying sheets to see the report content.
Add a company logo, employee photos, or other images to your dashboard.
Name your dashboard and better organize your widgets under various headings.
You can add interactive content to your dashboard, such as Tableau charts, Smartsheet Forms, YouTube videos, and more. However, you need access to the source application to do so.

Here is an example of how a dashboard might look with a combination of some of these widgets: