Generate live charts on Smartsheet dashboards using chart widgets.

You can add live charts as widgets on Smartsheet dashboards.
To create a chart widget:
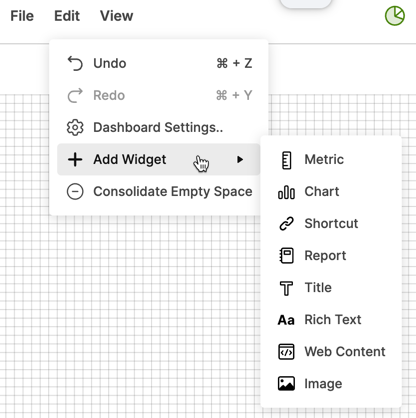
- On the right rail, select the + icon > Chart. Or select Edit > Add Widget > Chart.
- Before you can select your chart, you must first select your data. Select Add Data in the Data & Chart Type section.
- On the left side of the form, select the sheet or report that contains the table you want to chart. Then select the range of cells on the right side.
- Once you have your data, select OK.
If you need to change your data range later, edit the widget and click Edit Data to reselect the data range.
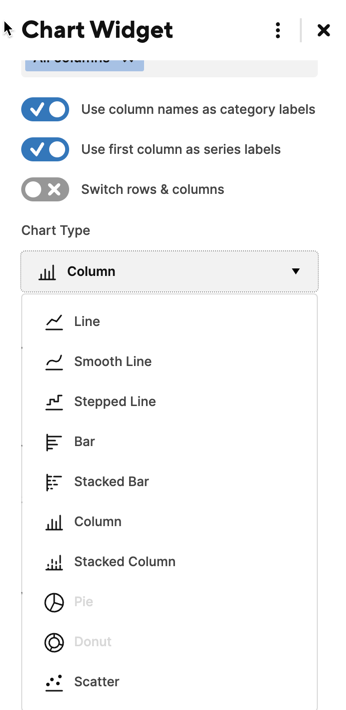
Once you’ve selected your data, select a chart type and formatting.
Select your chart type
Now that you’ve chosen the data you want to chart, you can select a chart to visually represent your data. Smartsheet automatically suggests a chart type based on how to format the data in your range. You can select a different chart type on the right side of the Edit Chart Widget form.
| Data you want to compare | Recommended chart |
|---|---|
How numbers have changed over time | line, smooth line, stepped line |
Directly compare numbers against each other | column, bar, stacked column, stacked bar |
Show how individual numbers relate to the whole of your data set | Pie, donut |
- If the data doesn’t look as expected, select Switch rows/columns.
- Pie and donut charts don't display zero values.
Available chart and column types
Chart types
You can choose from the following chart types:
- Line
- Smooth line
- Stepped line
- Bar
- Stacked bar
- Column
- Stacked column
- Pie
- Donut
- Scatter
Column types
The chart widget supports charting only for the following column types:
- Text/Number: Values must be numbers only
- Dropdown list: Numbers only, excluding text strings that look like numbers
- Auto-Number/System-generated column: Numbers with no prefix or suffix (no text)
- Symbols: Numbers only (You can't add symbols to charts)