Dashboards begin as a blank canvas, but take shape as you add informative, interactive widgets to them.
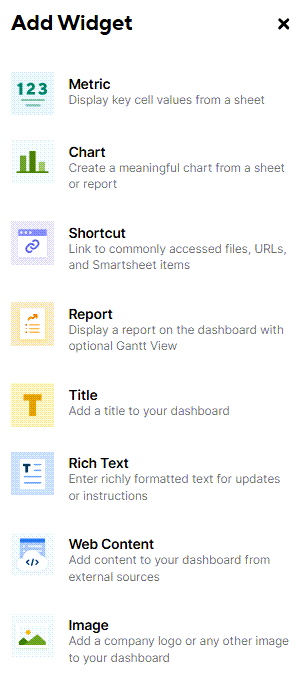
The Add Widget panel provides a brief description of each widget's function.
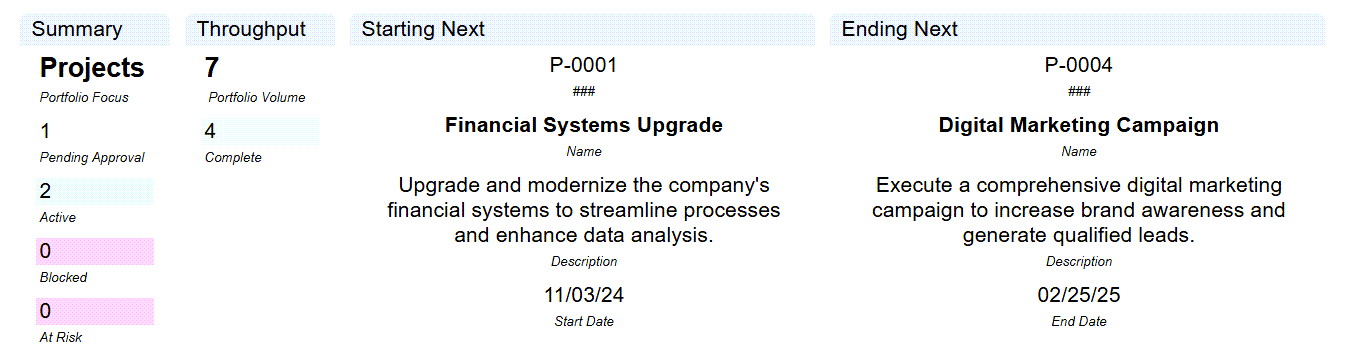
Use the metric widget to display content from one or more cells in a sheet. You need at least Editor permissions on the source sheet from which you want to display information.
The chart widget displays real-time data in a dashboard from a table on your sheet. You need at least Editor permissions on the source sheet from which you want to display information. Several chart types are available:
- Line
- Smooth line
- Stepped line
- Bar
- Stacked bar
- Colum
- Stacked column
- Pie
- Donut
- Scatter
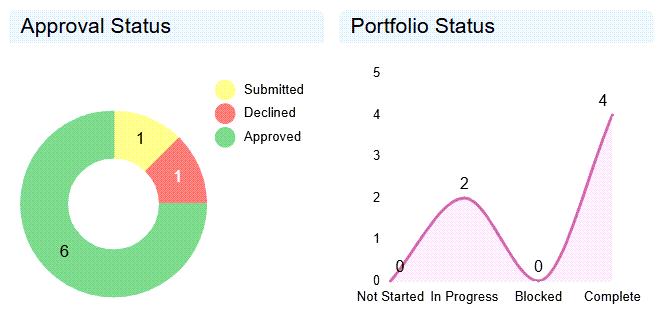
Explore the one that best suits your needs. Here is an example of a couple of them:
With the shortcut widget, create a link or a list of links to specific URLs, files, or Smartsheet items.

Add any text string you want to use for titles, instructions, updates, or any other type of text.
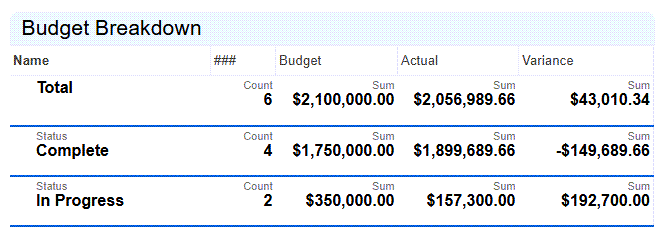
This widget allows you to display a report in your dashboard, but you need at least Admin access to the source report. Users shared to the dashboard don't always need access to the underlying sheets to see the report content.
Add a company logo, employee photos, or other images to your dashboard.
Name your dashboard and better organize your widgets under various headings.
You can add interactive content to your dashboard, such as Tableau charts, Smartsheet Forms, YouTube videos, and more. However, you need access to the source application to do so.

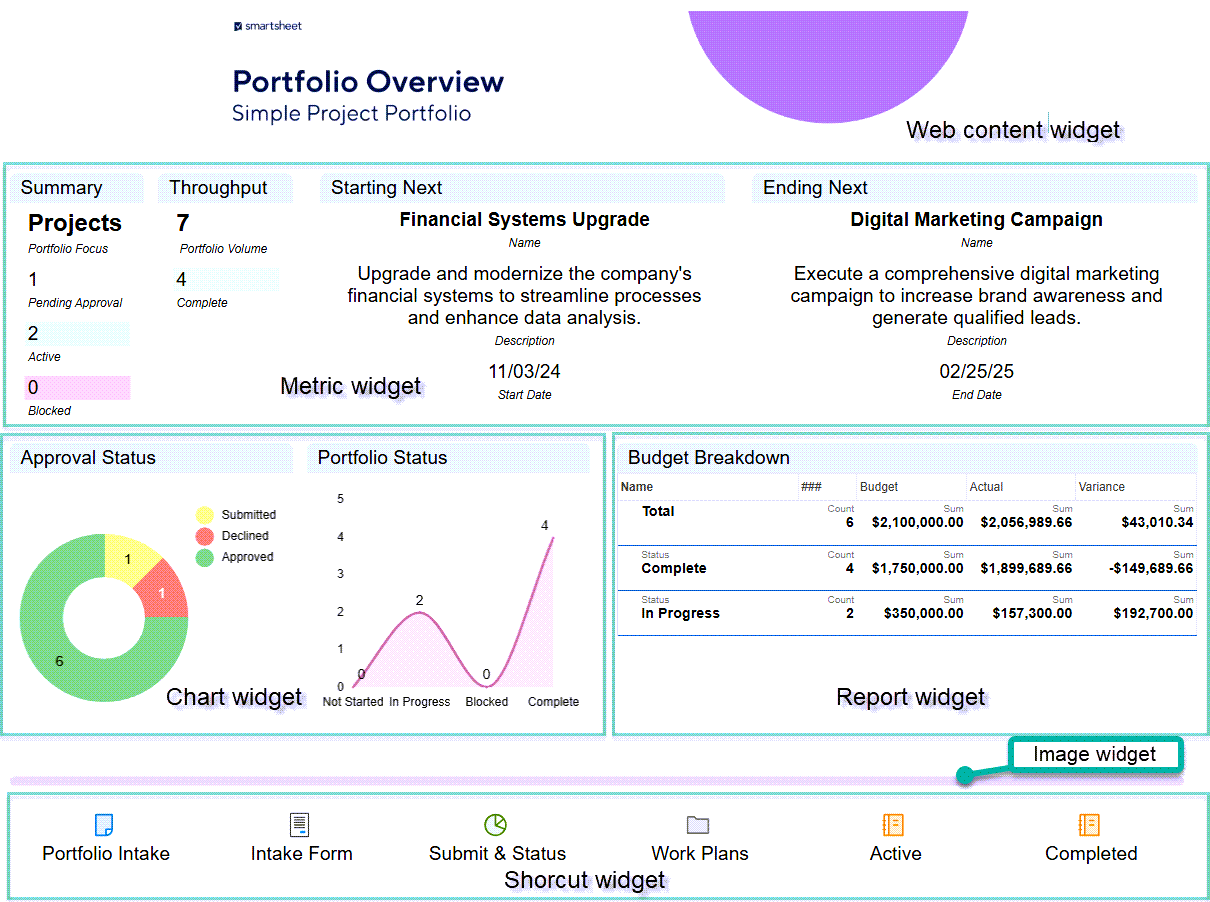
Here is an example of how a dashboard might look with a combination of some of these widgets: