Dashboards are the visual layer of work and allow you to summarize and share real-time data, project status, and key performance indicators with stakeholders.
USM Content
You must have sharing permissions to the source sheet or report to add data to chart, metric, and report widgets.
Create a new dashboard
- On the Home screen, you can create a new dashboard by selecting the +Create button on the left rail.
- Select Dashboard and select where to save it.
- Type a name for your dashboard, and then select OK.
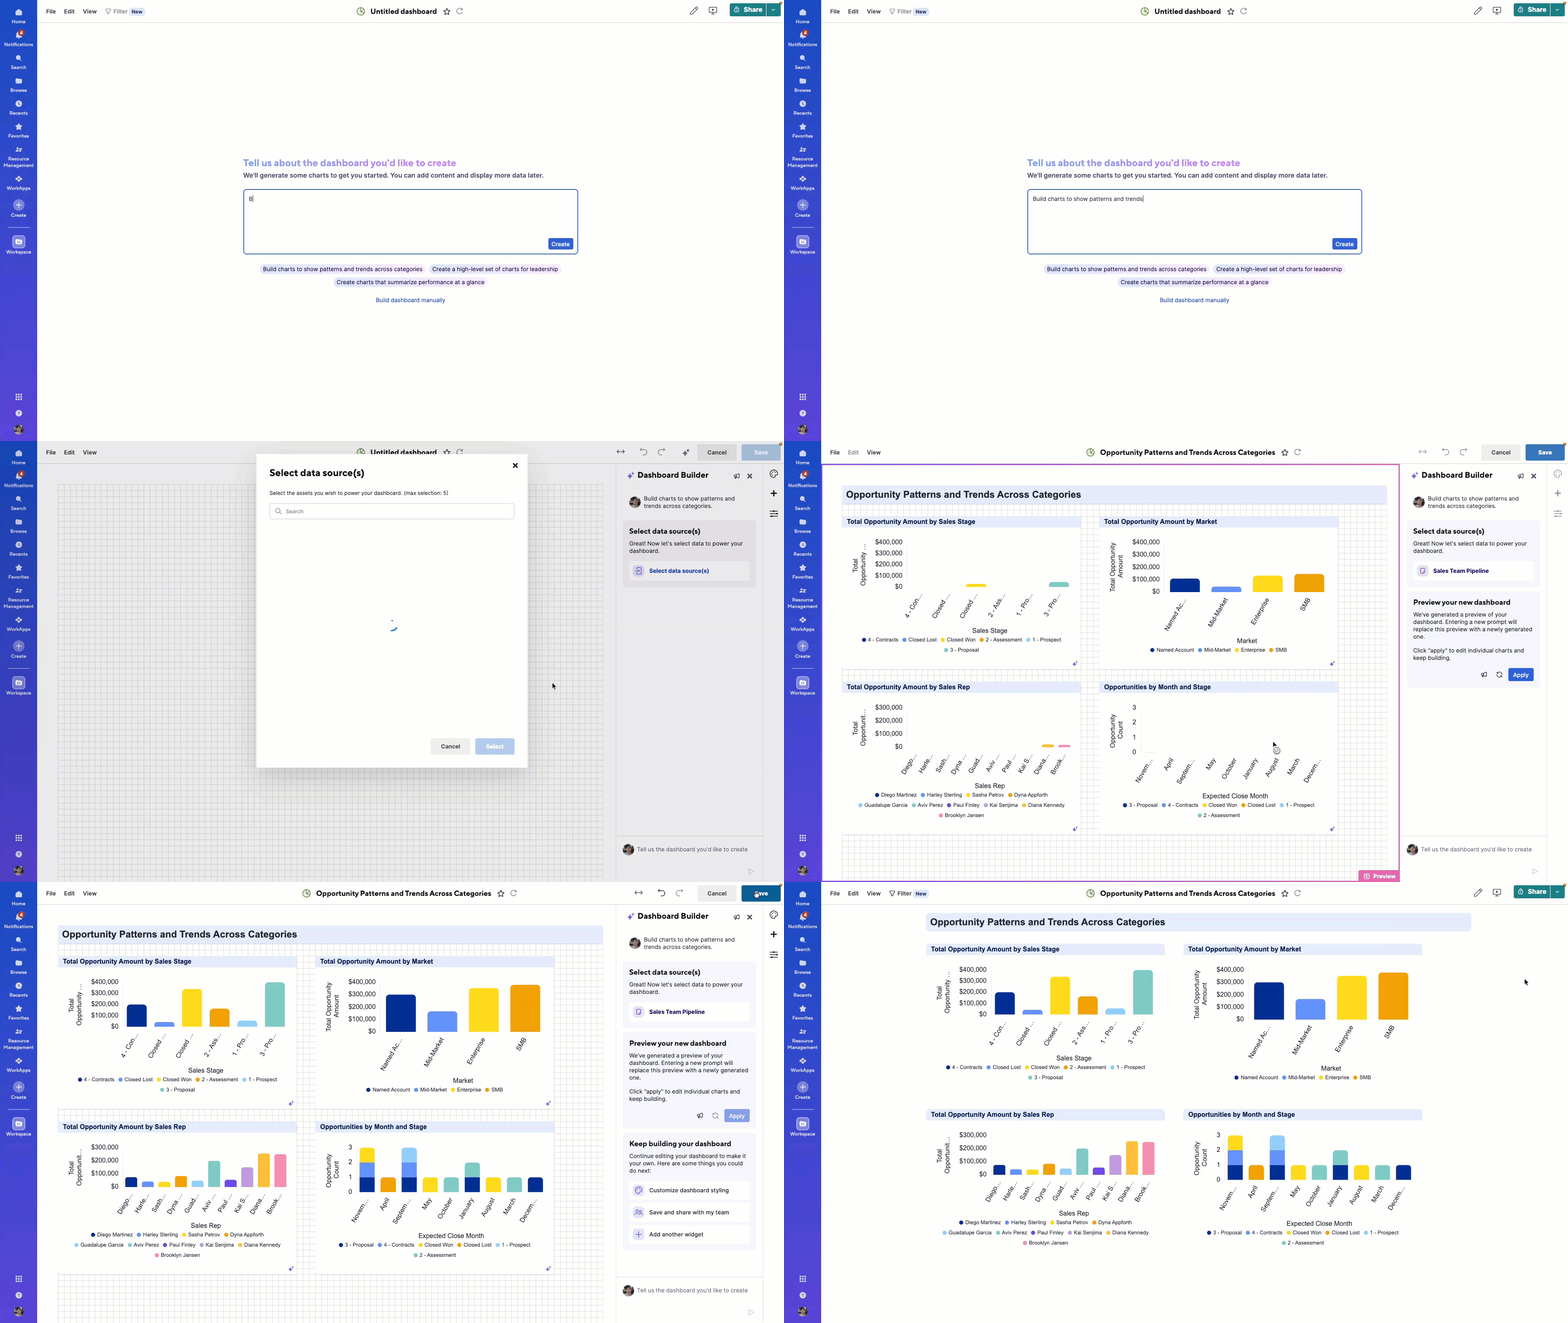
The Dashboard Builder opens. Here you have two options: describe what type of dashboard you’d like to create in the prompt box or select Build dashboard manually to start from scratch.
Create a dashboard with AI
This is a guided experience directly in the Smartsheet interface.
- Describe what you want to achieve with the Dashboard: What do you want to track? Then, select Create.
- Select your data source. You can select up to five sheets.
Smartsheet generates charts to get you started based on your prompt, which you can select to add to the dashboard or type in another prompt to get a closer result to what you are looking for.
Create a dashboard manually
- Select Build dashboard manually to open a blank dashboard.
- Add dashboard widgets.
- In the upper-right area of the dashboard, select Save.
Use the AI Chart widget to create your charts at any time.
Edit a dashboard
If you're the dashboard's Owner or Admin, you can change its background color and add or edit a widget. You can also access extra editing features from the shortcut menu.
You can also use AI to edit your dashboard.
Edit your dashboard with AI
- In the toolbar, select Edit Dashboard.
- Double-click any AI-created chart to open conversational editing
- Type a refinement prompt to refine the chart.
- Select Save.
Edit your dashboard manually
- In the toolbar, select Edit Dashboard .
- Select what you want to edit:
- Themes: Select a color theme for the entire dashboard and apply it to all your widgets. You can create your own theme or customize the canvas, widget, and chart colors.
Theme colors don’t apply to content within report and web content widgets.
Add Widget: Add the widgets you want to appear on your dashboard.
For details on editing widgets, refer to the widget-specific article. Find links to them here.
- Widen canvas: Select Widen canvas to make your canvas wider.
- Once you're done with your edits, select Save in the upper-right area of the screen.
You can also edit the dashboard with a right-click anywhere on the grid, and then select any of these actions:
- Paste Here: Paste a widget you copied.
- Consolidate Empty Space: Delete unused rows between the top and bottom widgets to free up vertical space on the dashboard. This presents the most compact version of the current dashboard, without altering the widget arrangement.
- Edit Dashboard Theme: The dashboard theme panel opens on the right-hand side.
- Add Widget: Add widgets to your dashboard.
You can use keyboard shortcuts in dashboards.
How to create a custom color
When selecting colors for fonts, charts, titles, and more, you can choose from standard presets or add a custom color using a HEX code, an RGB code, or a color gradient. You can save up to 39 custom colors in the dashboard color picker.
You can create a custom color from a theme or from a widget.
From a Theme
- In the toolbar, select Edit Dashboard.
- Select Themes. The dashboard theme panel appears on the right-hand side.
- Select Create theme in the right panel.
- Select the color you want to change.
- Select the plus icon. Pick a color, enter the hexadecimal color value or the RGB color code.
- Select Apply. Select the color created.
From a widget
- In the toolbar, select Edit Dashboard.
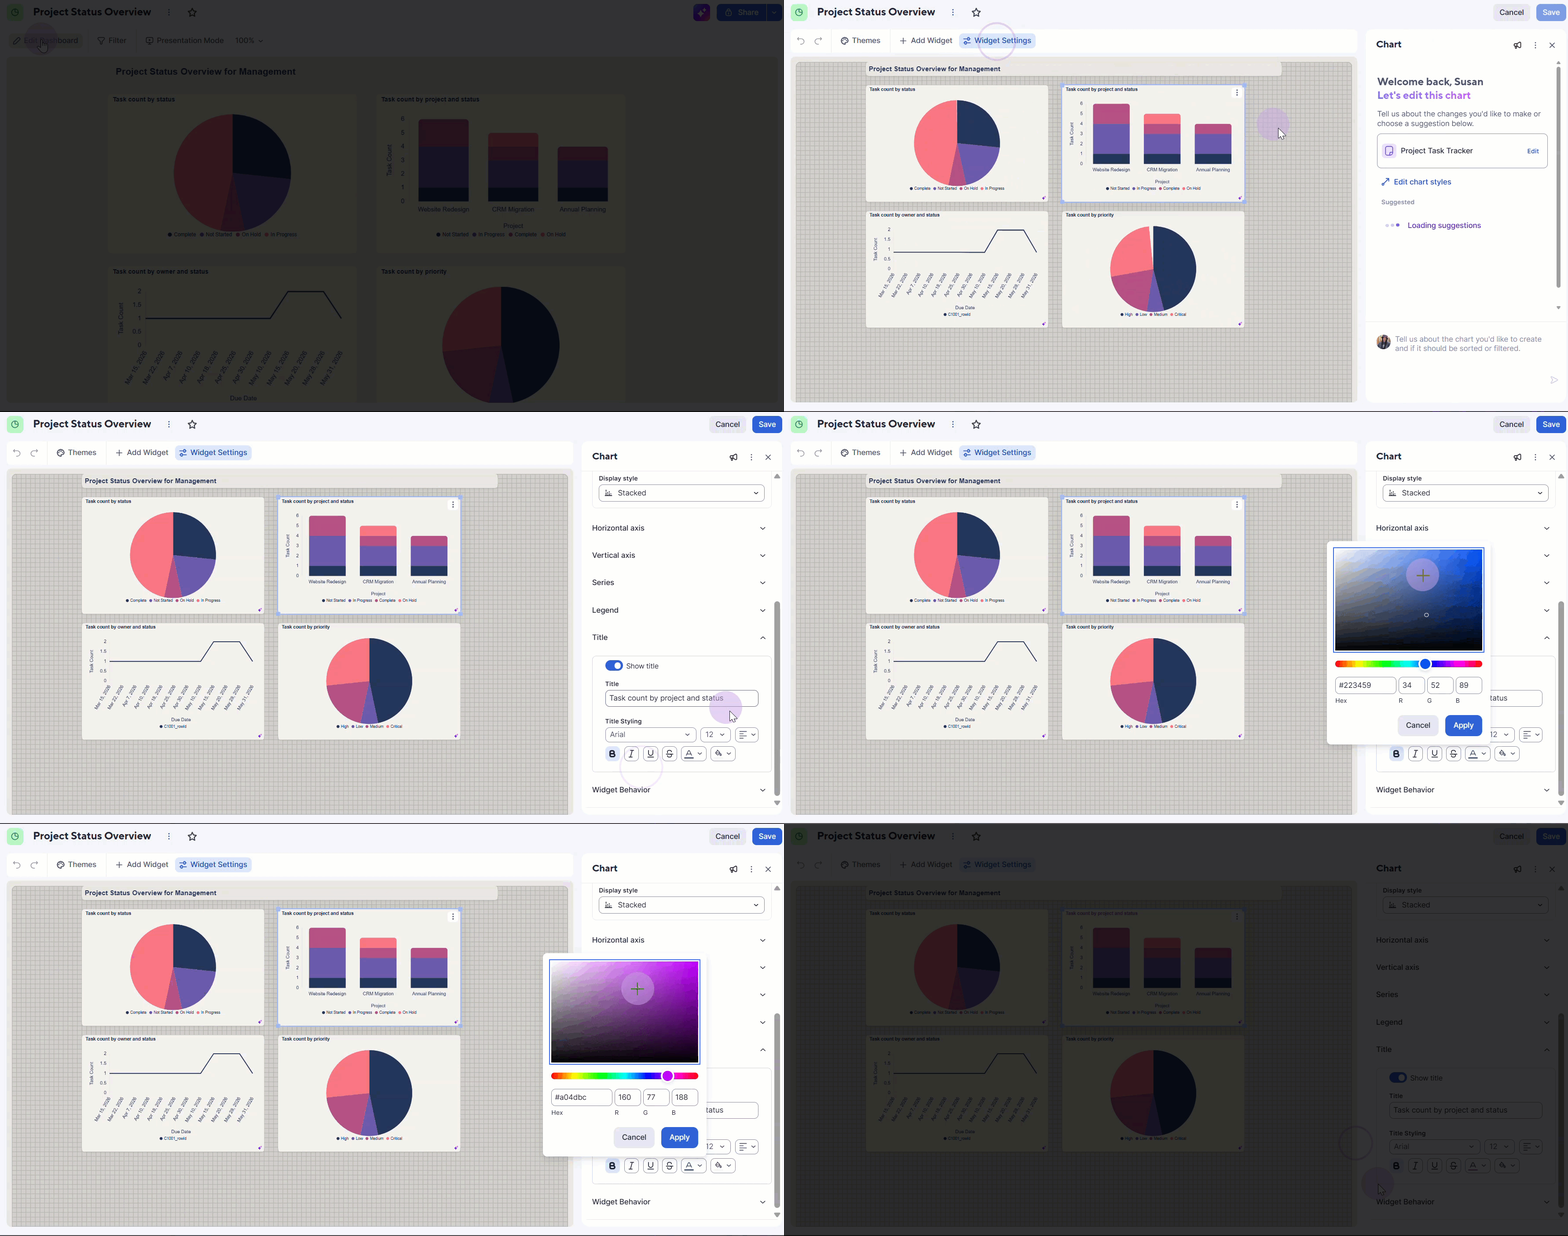
- Select a widget. Select Widget Settings.
There are multiple access points to add a customized color from a widget. You can do it from color fonts, series, or title backgrounds. The steps below use the title section as an example, as it is common for all widgets.
- Select Title in the right panel.
If you selected a widget built with AI, you might need to select Edit [widget type] styles, to manually edit the widget.
- Under Title Styling, select the color font or title background options.
- Select the plus icon. Pick a color, enter the hexadecimal color value or the RGB color code.
- Select Apply. Select the color created.
Automatic refresh on dashboards
A published dashboard automatically refreshes every 10 minutes. You can’t customize or turn off this behavior.
You can only change the Auto-Refresh feature for your dashboard view. For example, if you turn off Auto-Refresh, it remains enabled for other collaborators who are viewing the dashboard.
To edit the Auto-Refresh feature
- Select the More menu
 , next to the dashboard name.
 - Select Auto-Refresh.
- Select the change you'd like to apply:
- Select your frequency.
- To turn off the Auto-Refresh feature, select Off.
Web content widgets don't automatically refresh on dashboards.