Dashboards begin as a blank canvas, but take shape as you add informative, interactive widgets to them.
USM Content
Dashboard widgets are the building blocks of a Smartsheet dashboard, each one displaying a specific piece of information such as a chart, metric, report, or sheet data, or providing content like text, images, and shortcuts.

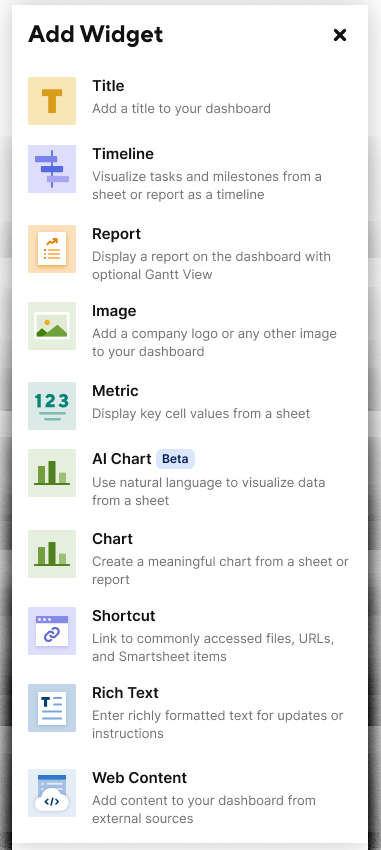
The Add Widget panel provides a brief description of each widget's function.
Metric widget
Use the metric widget to display content from one or more cells in a sheet. You need at least Editor permissions on the source sheet from which you want to display information.
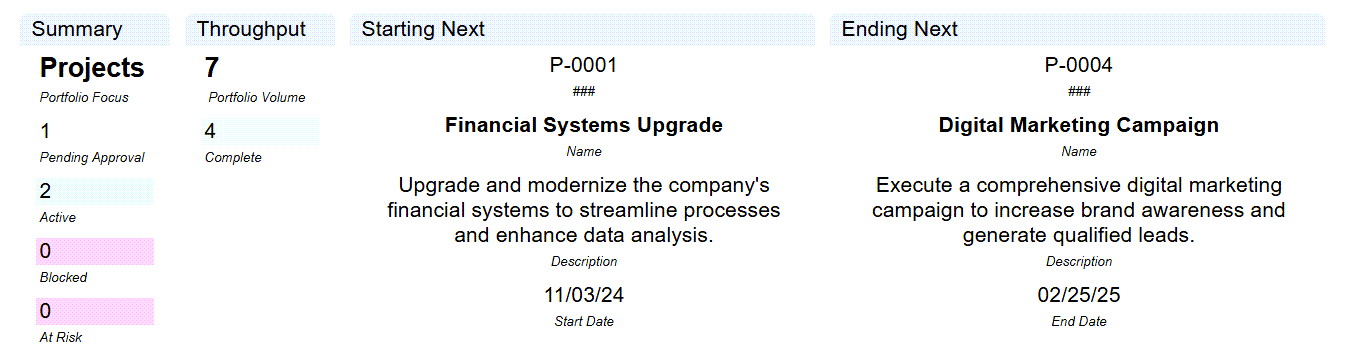
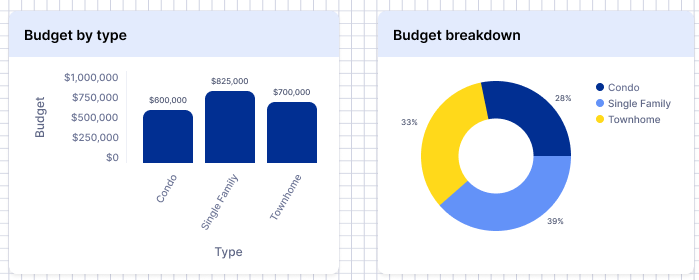
Chart widget
The chart widget displays real-time data from your sheet in a dashboard. Build it manually or using AI. You need at least Editor permissions on the source sheet or report from which you want to display information.
Timeline widget
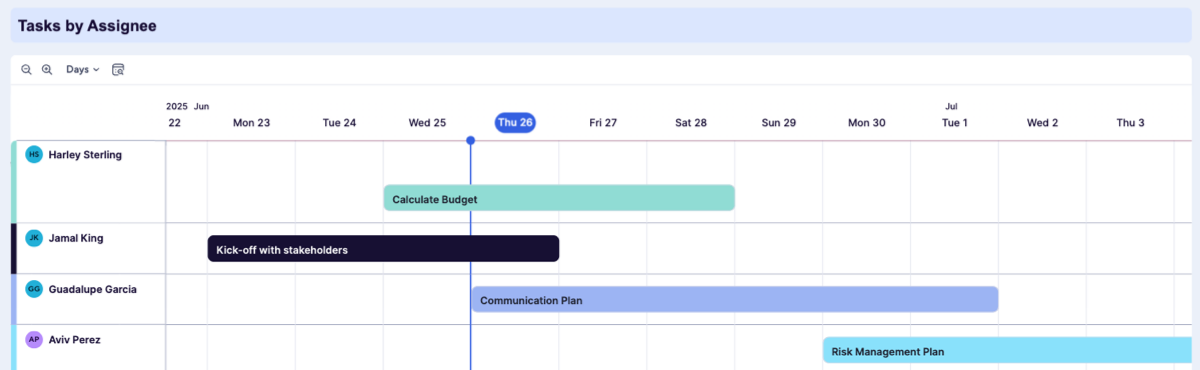
Use the timeline widget to display a sheet or reports's timeline view directly on your dashboard. This allows you to provide a visual representation of your project schedules and key milestones.
Report widget
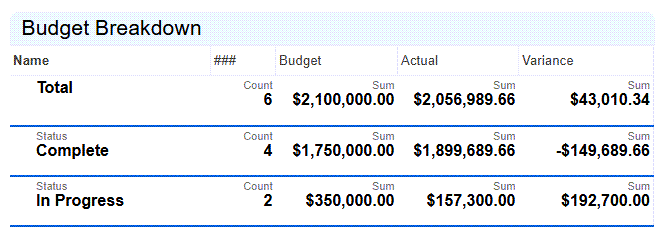
The report widget allows you to display a report in your dashboard, but you need at least Admin access to the source report. Users shared to the dashboard don't always need access to the underlying sheets to see the report content.
Title widget
With the title widget, you can better organize your widgets under various headings.
Rich text widget
Use a rich text widget to add any text string you want to use for titles, instructions, updates, or any other type of text.
Image widget
Use an image widget to add a company logo, employee photos, or other images to your dashboard.
Shortcut widget
With the shortcut widget, create a link or a list of links to specific URLs, files, or Smartsheet items.

Web content widget
Use the web content widget to add interactive content to your dashboard, such as Tableau charts, Smartsheet Forms, YouTube videos, and more. However, you need access to the source application to do so.