Smartsheet is designed to help you find the information you're looking for quickly.
Overview
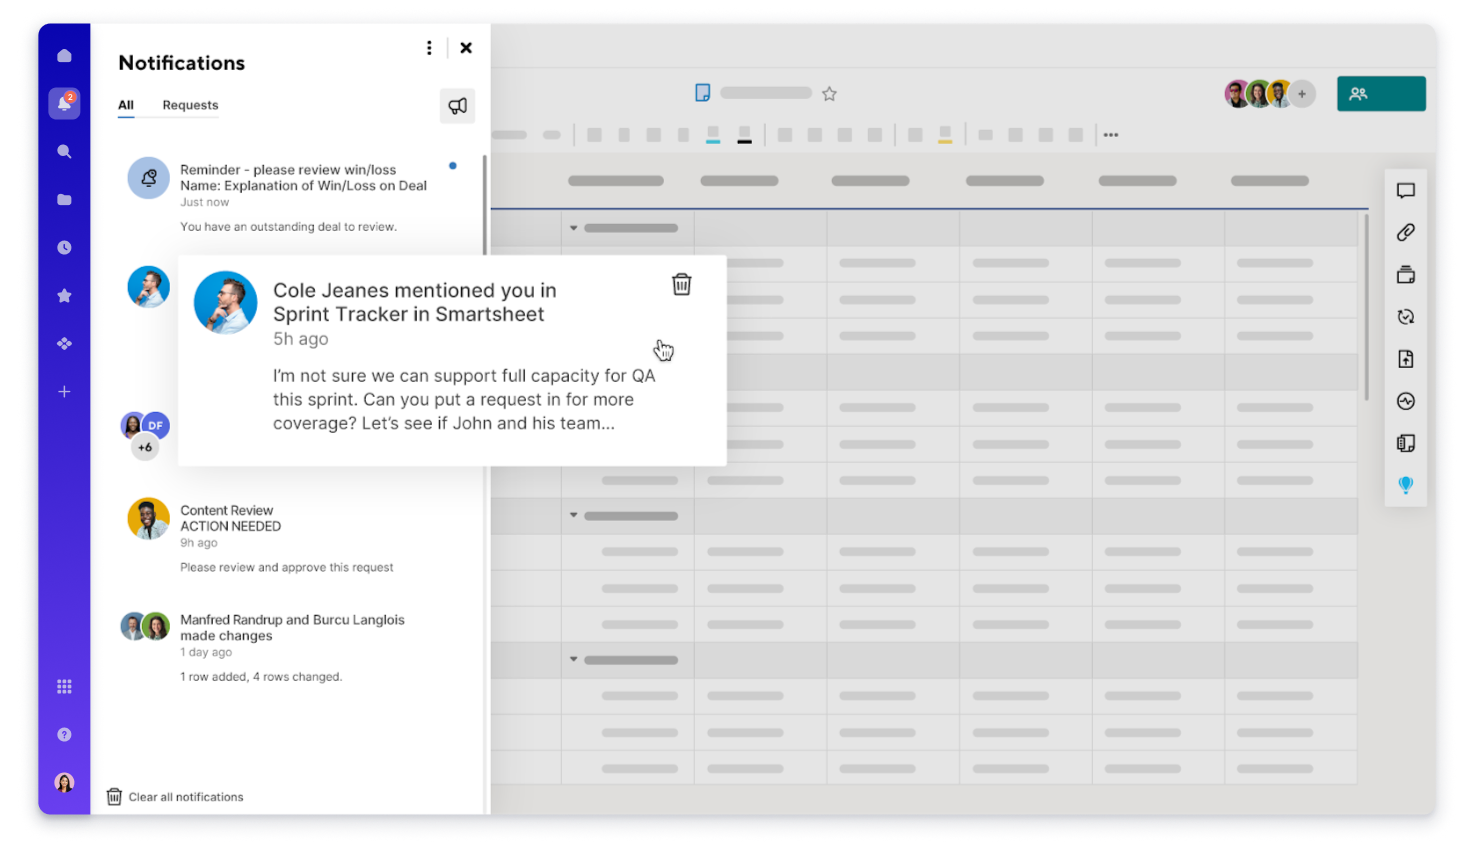
The left navigation bar is always visible providing you with global wayfinding tools to navigate in Smartsheet.
Brandfolder Image
The navigation bar contains links to the following: Home, Notifications, Search, Browse, Recents, Favorites, Create, Launcher, Help, and Account.
For more details, see Access and organize your work.
Feature bar
When you open a Smartsheet item, the right rail provides easy access tools to help you communicate and share your work.
You can access the following items from the feature bar:
Brandfolder Image
![]() Conversations
Conversations
Leave comments in a sheet, a specific row in a sheet, or a workspace.
Brandfolder Image
![]() Attachments
Attachments
Attach files to a sheet, specific row, or comment; access all attachments from the attachments panel.
Create and manage all proofs on your sheet. Quickly review and approve a variety of content.
Brandfolder Image
![]() Brandfolder
Brandfolder
Attach assets from Brandfolder to sheets or rows without leaving Smartsheet. Search, filter, and sort to locate assets exactly as you would in Brandfolder.
Create new update requests and manage pending update requests.
Brandfolder Image
![]() Publish
Publish
Publishing a sheet, report, or dashboard generates a unique URL anyone can access without logging in to Smartsheet. Publishing also generates an iframe code you can embed on a website to display the sheet or report.
Brandfolder Image
![]() Activity Log
Activity Log
See a list of all changes made to an item, who made them, and when. The Activity Log shows changes such as row deletion, who has viewed the item, and any sharing permission changes.
Brandfolder Image
![]() Summary
Summary
Use the sheet summary pane to define, organize, and report information related to your work. You can embed formulas in sheet summary fields to see key metrics every time you open the sheet summary pane. Summary fields can contain data, hyperlinks, images, and more.
Brandfolder Image
![]() Resource Management
Resource Management
Connecting a project sheet to Resource Management allows you to see how resource changes affect your entire plan. You can also make changes to your plan from the panel. It's a two-step process to use the panel. First, authorize your account (one time only), then connect a project sheet to Resource Management.
Brandfolder Image
![]() Work Insights
Work Insights
Analyze and visualize your sheet's data automatically through column snapshots, total new rows added each day/week/month, and the number of rows across two-column values.
Brandfolder Image
![]() Connections (Jira, Salesforce, and Microsoft Dynamics 365)
Connections (Jira, Salesforce, and Microsoft Dynamics 365)
Connect sheets to Jira, Salesforce, or Microsoft Dynamics 365 with the Connector Access Navigation button. A popup shows details of any existing connector workflows or the details of all connectors with navigation options, depending on the organization and user status.
Brandfolder Image
![]() AI (Analyze data, Generate formulas, Text and summaries)
AI (Analyze data, Generate formulas, Text and summaries)
Get insights, create charts, add formulas, or draft text and summaries with the power of AI. Use the AI Tools panel to select your preferred tool.
AI is available for Enterprise plans only.
Open an item in a new browser tab (Google Chrome)
- Locate the item that you want to open.
- Hold down Ctrl+Enter (Windows) OR Command (Mac), then select the item.