Reporting

Who can use this?

Plans:

  • Smartsheet
  • Pro
  • Business
  • Enterprise

Discover how to create data-driven reports in Smartsheet. Learn to compile and present information in a way that highlights significant trends, helps you track progress, and improves decision-making.

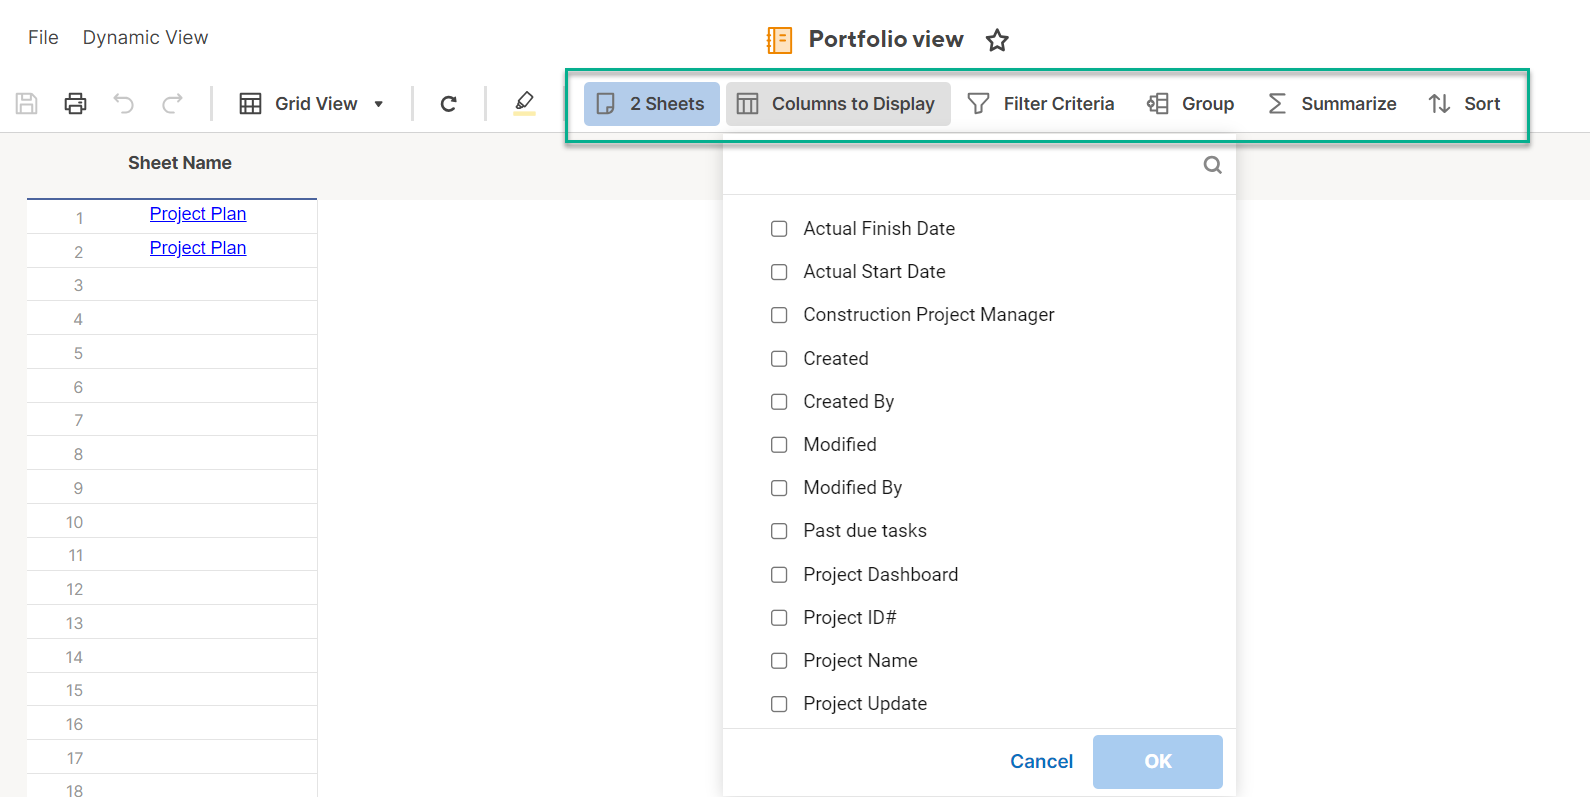
Smartsheet reports allow you to easily work with real-time data from multiple sheets in a single view. You can consolidate key tasks and milestones into an overview for stakeholders, or create different views for various initiatives.

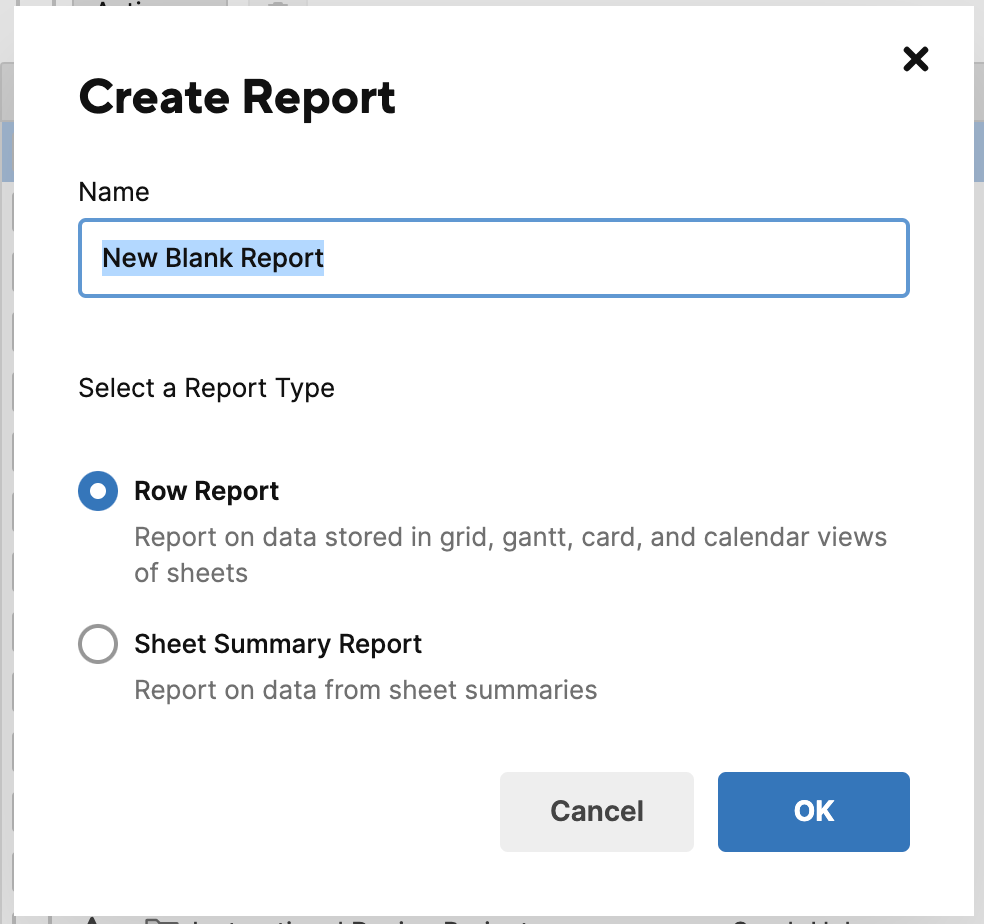
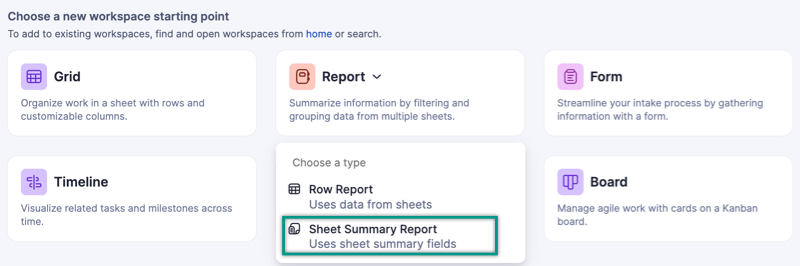
Reports are bi-directional, so information updated on a report automatically updates back to the underlying sheets and vice versa. You can build a row report from rows and columns on a sheet, or a sheet summary report from the sheet summary fields.

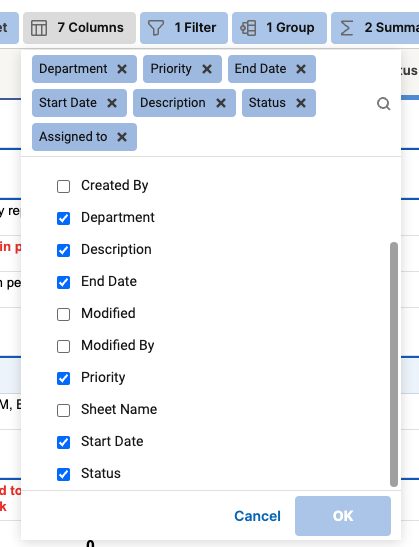
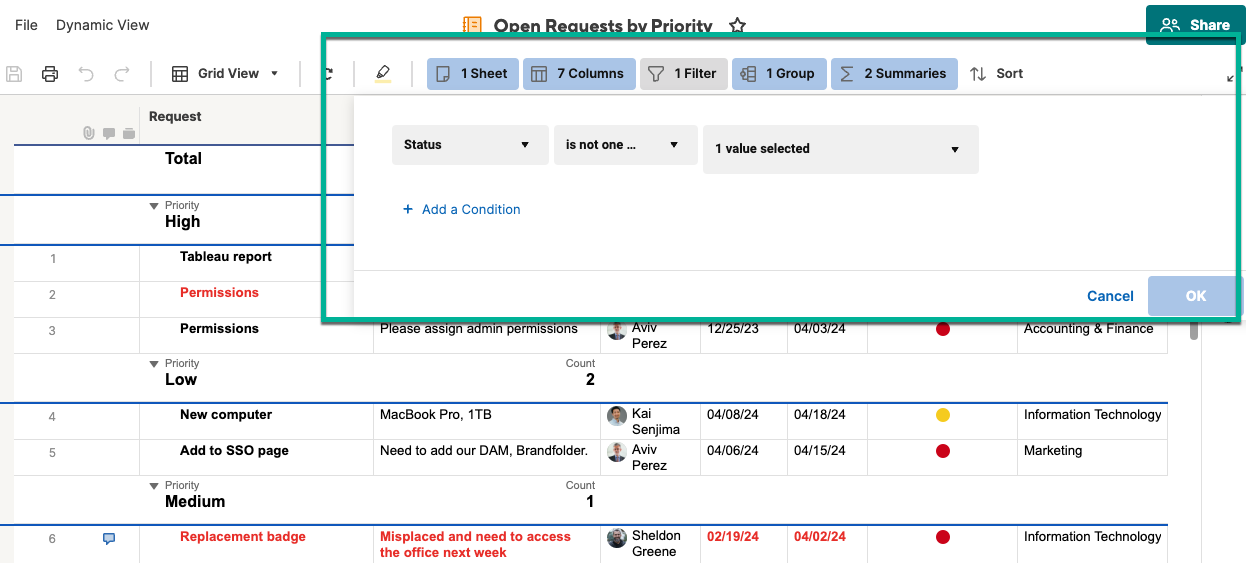
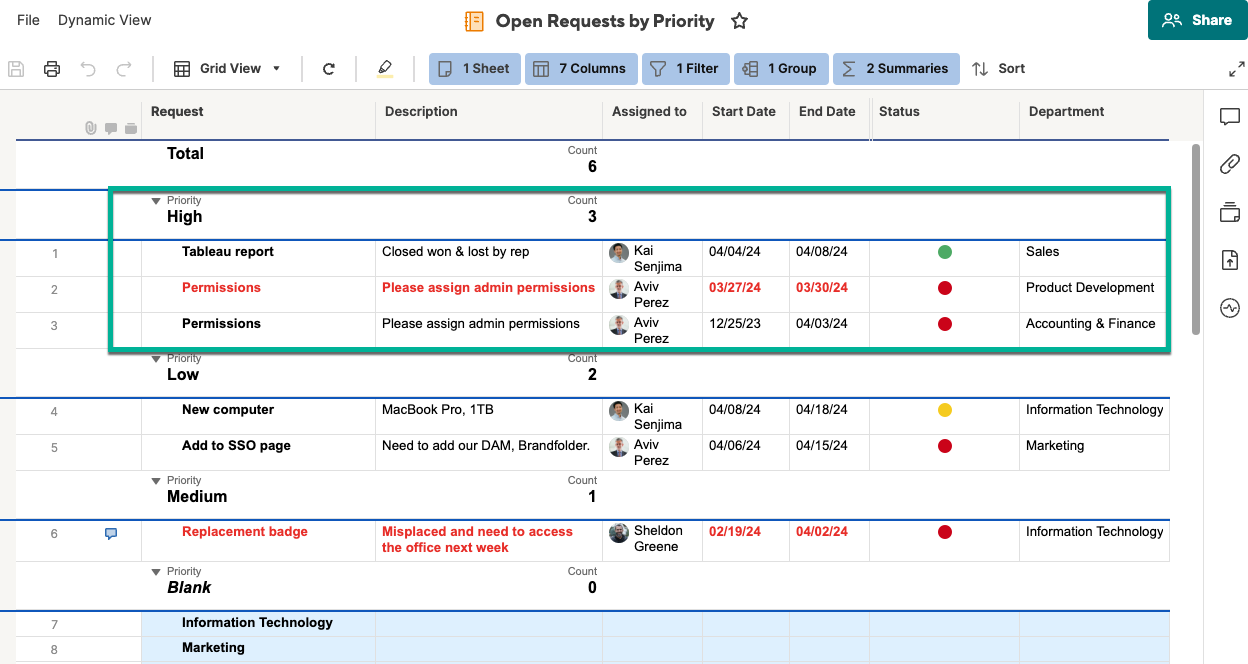
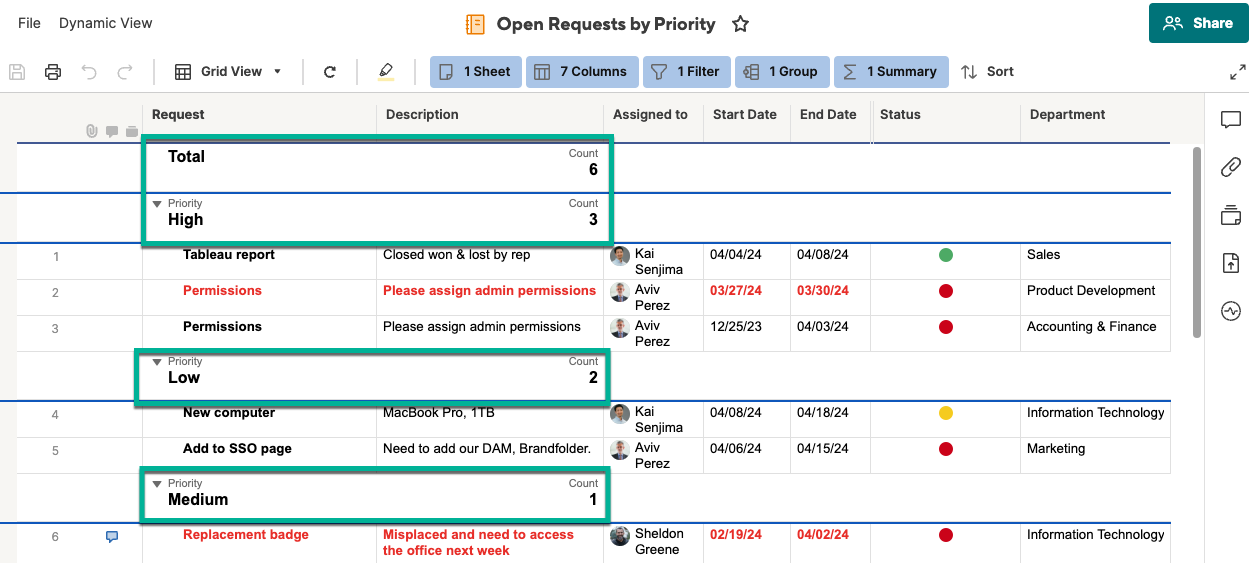
Grouping and summarizing reports provide quick and easy aggregation and calculation across data from multiple sheets.

Reports can easily be shared with anyone who is also shared with the underlying sheets populating the report. For more granular control, you can publish your report or display it in a dashboard, ensuring that your audience only sees the high-level information you want to display without requiring that they be shared with the underlying data.

Report types

Who can use this?

Plans:

  • Smartsheet
  • Pro
  • Business
  • Enterprise

Reports are bidirectional, meaning the information updated on a report automatically updates back to the underlying sheets and vice versa.

You can send, share, and publish a report like a sheet. You can also edit, group, summarize, and sort the data in the report.

  • You can share reports with anyone also shared to the underlying sheets populating the report.
  • If you don’t want to share the underlying sheets with your audience, publish your report or display it in a dashboard. This way, you ensure your audience only sees the high-level information you want to display.

Note that because it doesn’t store any information, reports only display information stored in sheets. That’s why reports don’t count against the sheet limit for your plan.

Your report can source data from a maximum of 30,000 sheets.

Two types of reports are available: row reports and sheet summary reports.

Row Reports

With Row Reports, you can aggregate row information from multiple sheets. For example, you can create a report to see all your high-priority incomplete tasks pulled from multiple sheets.

Sheet Summary Reports

With Sheet Summary Reports, you can display summary data from multiple sheets. Sheet summary reports are a great way to get a high-level overview of multiple projects or to highlight portfolio-level metrics in a dashboard.

These reports aggregate sheet summary fields from one or more sheets into a single report to surface key metrics based on report criteria.

Build a row report

Who can use this?

Plans:

  • Smartsheet
  • Pro
  • Business
  • Enterprise

Permissions:

  • Admin

Find out if this capability is included in Smartsheet Regions or Smartsheet Gov.

You can add rows from multiple sheets into one report with a row report. If you need to add multiple sheet summaries into one report, create a sheet summary report.

Create a Row report

  1. Select the Browse tab, then select Workspaces.
  2. Find the workspace you want the report to live in. Select the workspace name to open it. 
  3. Select Create.
  4. Select Report.
  5. Then select the Row Report option.

    Brandfolder Image
    Create a new report screen

Configure the report

If you are working with large amounts of data, consider applying additional summary filters to the report during configuration. Sheet name, Created (date), and Modified (date) can limit the data included and help your reports run more efficiently.

Source Sheets

Source sheets are the sheets you want to pull in data from for the row report. You can have up to 30,000 source sheets for the report. You cannot use reports as source sheets for other reports.

Columns displayed

In the columns displayed dropdown, select the columns from your source sheets that you want to add to your report. You can have up to 400 columns selected.

Brandfolder Image
build a row report

Filter criteria

Set filter criteria to filter the data that gets pulled into your report from the source sheets. Only the data that meets your filtering criteria will be displayed in the report.

Brandfolder Image
build a row report

Group

Organize your data into groups which help you easily access the information you need.

Brandfolder Image
build a row report

Summarize

Summarize your data by defining key metrics to help you make informed decisions. Summary data is always displayed in the grouping row and cannot be formatted differently.

Brandfolder Image
build a row report

Sort

Sort the data in each group in a particular order: Oldest to Newest or Newest to Oldest.

Brandfolder Image
build a row report

Create a sheet summary report

Who can use this?

Plans:

  • Smartsheet
  • Pro
  • Business
  • Enterprise

Prerequisites

To create a portfolio view, you need:

  1. Your source sheets. The information in each sheet summary is the information you can pull into the report. 
  2. A sheet summary report. 

Create your sheet summary report

  1. On the left Menu bar, select Create (plus icon).
  2. Scroll down to the bottom of the page and select Report > Sheet Summary Report.

    Brandfolder Image
    Create a sheet summary report

Your new report opens and you can start editing it!


Define what you want to see in the report

On the report toolbar, you can use the tools described in the table below to define what and how you want to see it in the report.

Use this tabTo do this
Source Sheets Specify which sheets and summaries will be pulled into this report.

If you select a workspace, you pull all the sheets in that workspace, and the report updates when sheets are added and removed from the workspace. If you select a folder, you pull only the sheets inside the folder, and the report doesn’t update automatically when the contents of the folder change.
Columns to Display Select the summary fields or system columns for this report.
Filter Criteria Define parameters for summary information displayed in the report.
Group Combine similar values into groups to organize rows into logical categories or classifications.
Summarize Extract key information from your report, such as the Count of completed projects.
Sort Define how summary information is sorted in the report.

Your first step will always be to select your source sheets. Then, select what columns you want to display.

Brandfolder Image
Create sheet summary report

After that, you can use the Filter Criteria, Group, Summarize, and Sort tools to organize the information how you want to see it.


Edit custom sheet summary fields from the report 

You can edit the fields in your portfolio view report right in the report; you do not need to go back to the summary field in the underlying sheet to make changes.

  1. Select the Kebab  Brandfolder Image Data Shuttle kebab menu  menu on the left side cell of the row you want to modify.
  2. Select Edit. The Edit form will open if the source sheet has custom fields. Otherwise, you'll see the message: "This sheet has no custom summary fields defined."
  3. Enter your changes and select Save.
Brandfolder Image
Create sheet summary report

Keep the following in mind  

  • Ensure all your field names are consistent across sheets. 
  • Use the same field type across all summary fields used to collect the same data type. For example, if you are aggregating budget information, ensure all columns in all included sheets have budget formatted as currency. If you have different field types, for example, currency and numeric, you will get a column for each field type.

    The Sheet Summary Report is not available for Premium Apps. For example, you can't use a Sheet Summary type of Report as a source for your Dynamic View.