With a row report you can:
- Create filters for relevant information in a sheet
- Restrict users to editing only the important columns or rows
- Combine information from multiple sheets into a single report.
You can add rows from multiple sheets into one report with a row report. If you need to add multiple sheet summaries into one report, create a sheet summary report.
Create a Row report
- Select the Browse tab, then select Workspaces.
- Find the workspace you want the report to live in. Select the workspace name to open it.
- Select Create.
- Select Report.
Then select the Row Report option.
Brandfolder Image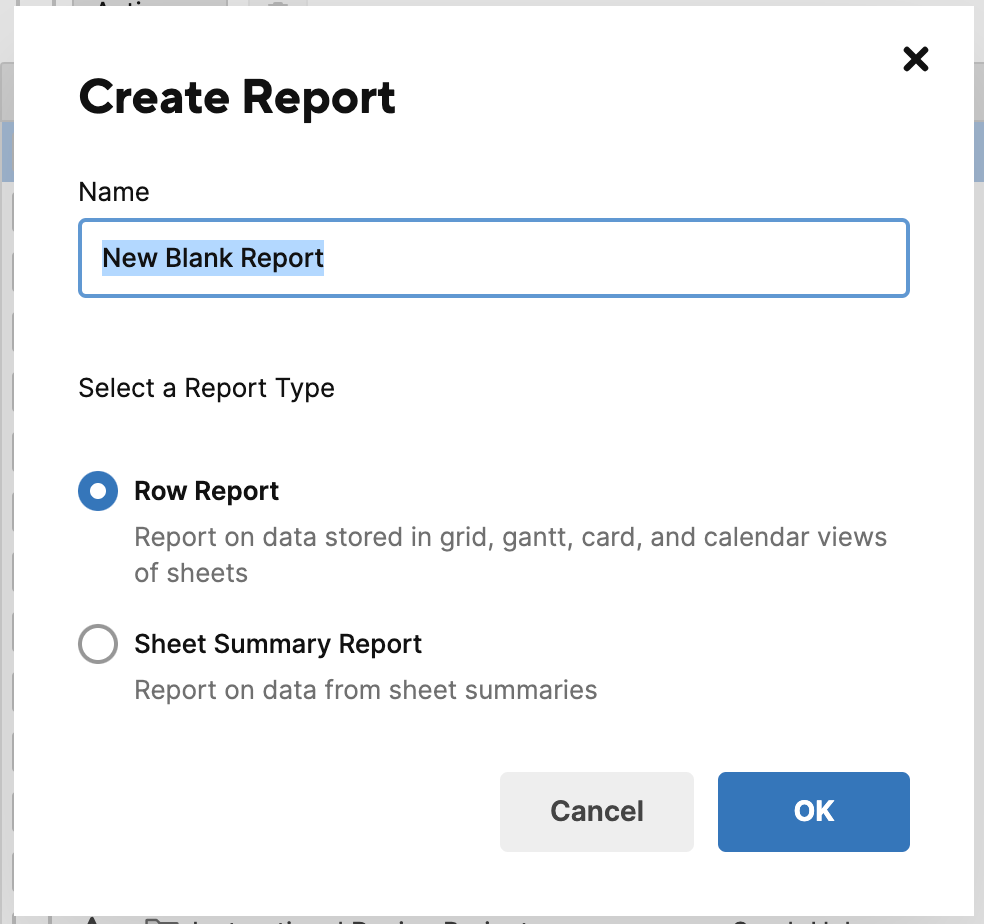
Configure the report
If you are working with large amounts of data, consider applying additional summary filters to the report during configuration. Sheet name, Created (date), and Modified (date) can limit the data included and help your reports run more efficiently.
Source Sheets
Source sheets are the sheets you want to pull in data from for the row report. You can have up to 30,000 source sheets for the report. You cannot use reports as source sheets for other reports.
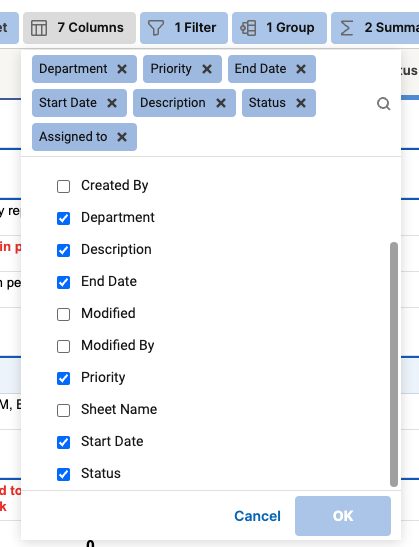
Columns displayed
In the columns displayed dropdown, select the columns from your source sheets that you want to add to your report. You can have up to 400 columns selected.
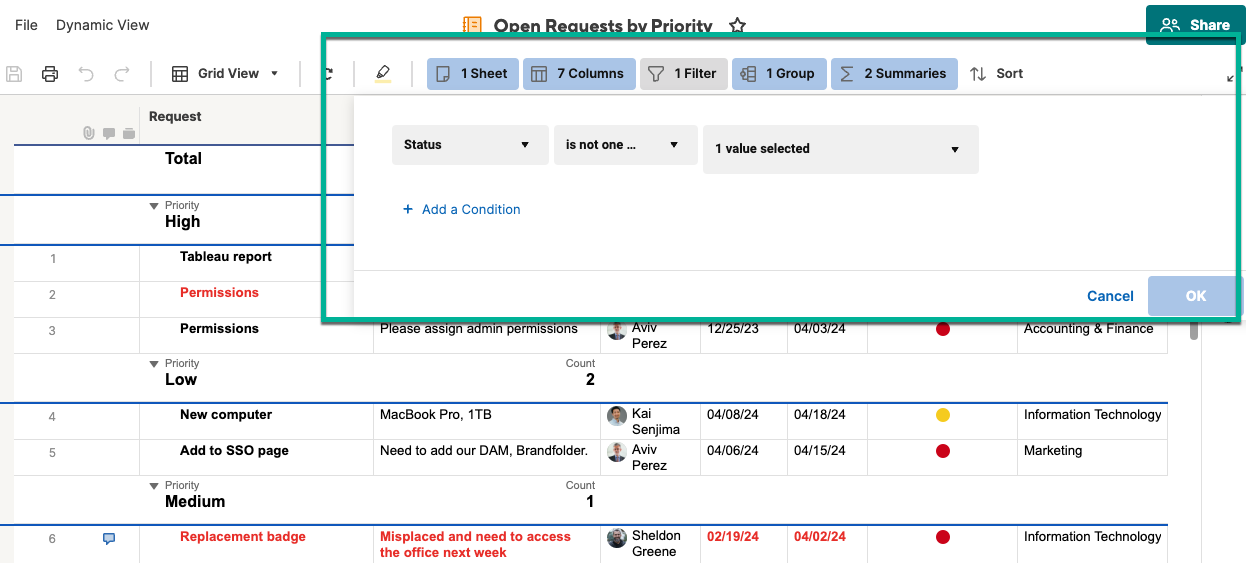
Filter criteria
Set filter criteria to filter the data that gets pulled into your report from the source sheets. Only the data that meets your filtering criteria will be displayed in the report.
Group
Organize your data into groups which help you easily access the information you need.
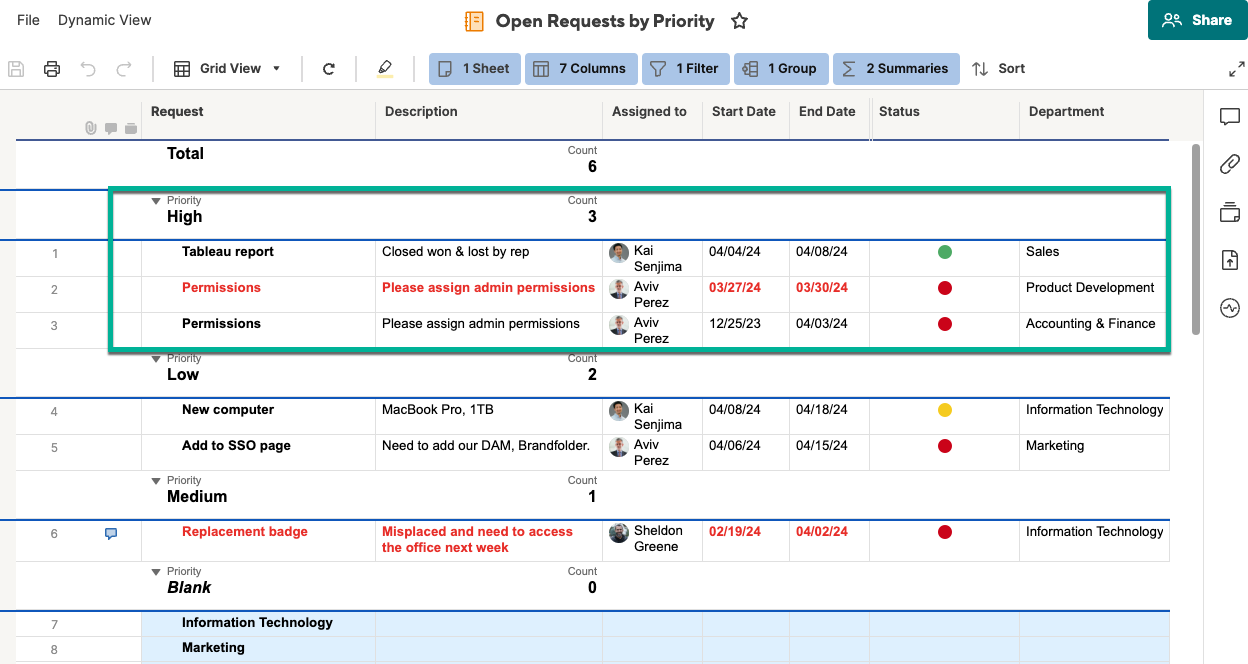
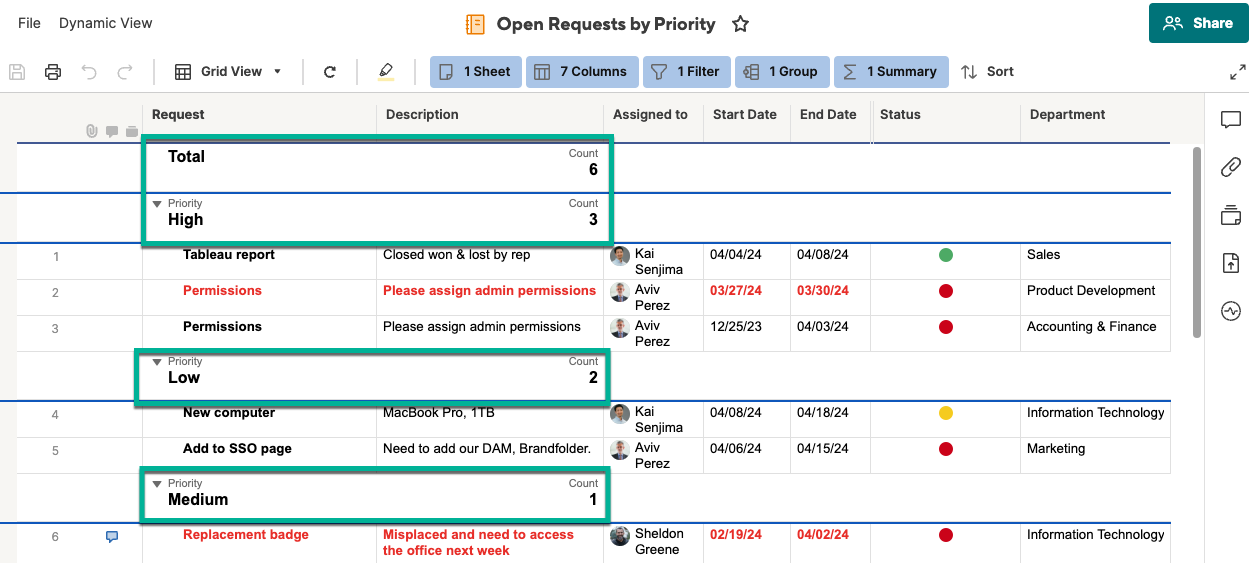
Summarize
Summarize your data by defining key metrics to help you make informed decisions. Summary data is always displayed in the grouping row and cannot be formatted differently.
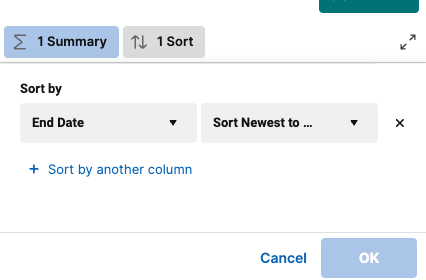
Sort
Sort the data in each group in a particular order: Oldest to Newest or Newest to Oldest.