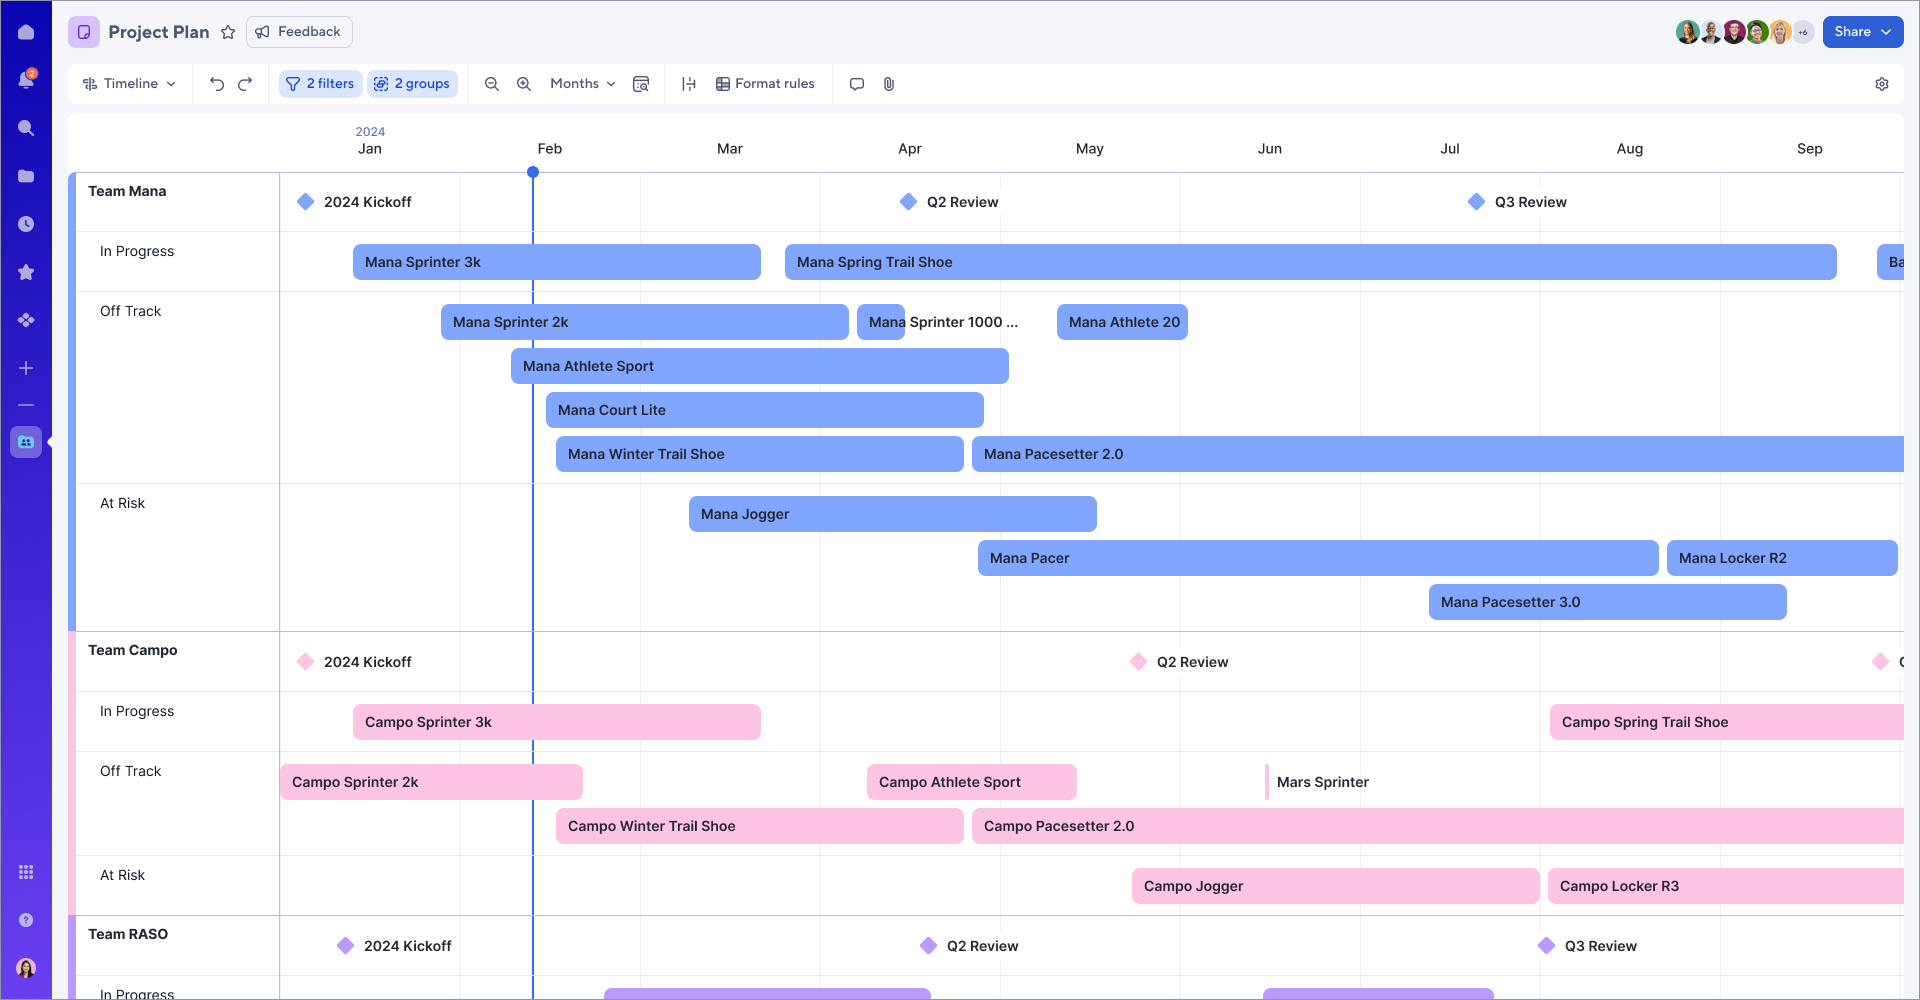
Timeline view displays date-based work on a horizontal timeline. Use timeline view to create project roadmaps, or to plan, track, and manage tasks, work, and portfolios.
USM Content

With timeline view, you can easily see what’s happening now and what’s coming next, helping your team and stakeholders stay focused and aligned on common goals. This streamlined view is ideal for summarizing a roadmap or providing a portfolio overview of multiple projects. When you switch to timeline, the look and layout of the sheet controls are different, and some features, such as the file menu, access to forms, and automations, may not yet be available.
Timeline view allows you to:
- See date-based work on a timeline
- Group data into horizontal lanes and filter down to specific items
- View and edit milestone and bar details
- Zoom in or out to see more or less data
- Scroll to see future or past work
When to use timeline view
You should use timeline view when you need a visual representation of your project’s key dates and phases without the clutter of unnecessary details. Use timeline view to:
- Highlight key milestones and ensure that critical dates and deliverables stand out.
- Provide a high-level overview of a project or multiple projects for stakeholders.
- Focus on date-based work management to ensure alignment and clarity.
You need to have a Business or Enterprise plan to use timeline view. Learn more about upgrading your plan.
Access timeline view
To switch to timeline view:
- Navigate to the top toolbar on your sheet.
- Select the layout switcher.
- Select Timeline from the dropdown menu.
Configure your sheet for timeline view
If a sheet has no date columns, the Timeline option in the sheet layout switcher is not selectable.
Timeline is available in any sheet with at least one date column (that is not backed by a column formula). If your sheet has one date column, all items with a date provided will appear as a milestone (diamond) on the timeline. Any items missing a date will not appear on the view.
If your sheet has two or more date columns (that are not backed by a column formula), then the first two date columns are automatically set as the start date and end date in project settings. All items with at least one date provided (either start or end date) appear on the timeline as milestones, and all items with two dates provided (start and end date) appear on the timeline as bars. Any items missing both a start and end date will not appear on the view.
Timeline and sheet settings
Select the settings icon
Brandfolder Image
![]() on the toolbar. On the sheet tab, you can edit the columns used for the start and end dates of the project. To edit dependencies, working days, or Resource Management, switch to grid or Gantt view and update your sheet’s project settings.
on the toolbar. On the sheet tab, you can edit the columns used for the start and end dates of the project. To edit dependencies, working days, or Resource Management, switch to grid or Gantt view and update your sheet’s project settings.
On the timeline tab, you can edit the column used for the item title.
Create and edit timeline items
Timeline view displays data as bars (multi-day duration events) or milestones (zero-day duration events). Hover over bars and milestones to see their full name and their start and end dates. Changes to bars and milestones made by other users are displayed in real time.
On the timeline, bar and milestone stack order is determined by (1) hierarchy level, (2) start date, (3) end date, and (4) grid row order.
If a sheet has project settings configured with dependencies enabled, and predecessor/duration columns defined, then timeline uses duration values to determine whether an item appears as a bar (1+ day duration) or milestone (0 day duration).
Create items on the timeline
Users with Editor and Admin permissions can create items on the timeline. You can select anywhere on your timeline where your cursor displays a (+) to add a new item. This opens a menu and prompts you to provide the item’s title, start date (required), and end date. Select Add, and the item appears on your timeline.
If you provide a start and end date, the item created is a bar. If you only provide a start date, then the item created is a milestone.
Use the menu on the timeline items to delete them. Open the menu, then select Delete item.
View and edit timeline item details
Right-click and select Edit details or double-click on the bars or milestones to see all of the item’s details and edit them as needed. Changes are saved immediately. Any columns that are hidden in grid view do not appear in the details panel.
If you assign colors to dropdown values in the table view, they will also appear in the timeline view when you open the details panel. If you need to edit the colors or configure additional colored drop-down values, switch to table view and use the column properties menu to edit the colors. Learn more about colored dropdown values.
Edit item colors
Timeline displays task bar colors from Gantt, card, or calendar view on its bars and milestones. Editing item colors using conditional formatting helps visually differentiate tasks based on status or priority, making it easier to quickly assess project health and identify areas needing attention. To edit these bar and milestone colors, switch to Gantt, card, or calendar view and either:
- Manually apply a task bar color by right-clicking on the color bar
- Apply conditional formatting rules, specifically setting the task bar color
If your sheet has at least one conditional formatting rule that sets task bar color, then all bars on the sheet that don’t meet your conditional formatting rule are grey.
Edit item titles
Customizing item titles allows you to highlight the most relevant information in a way that suits your team’s needs. Bar and milestone titles are pulled from the sheet’s primary column by default. You can customize which column is used to define item titles via timeline Settings . Open the settings panel
Brandfolder Image
![]() , then select Timeline. Only text/number or auto number columns can be selected. When you change the item title, these changes are applied for all viewers of the sheet.
, then select Timeline. Only text/number or auto number columns can be selected. When you change the item title, these changes are applied for all viewers of the sheet.
You can also set how the item title is displayed - fully visible or shortened. The option you pick here is user-specific and does not apply to all viewers of the sheet. Select the toolbar button, then pick one of the three available options:
- No text overflow- Bar titles are shortened to fit within the bar; milestone titles are limited to 20 characters.
- Partial text overflow- Bar & milestone titles only display the first 20 characters of text.
- Full text overflow- Bar & milestone titles can display up to 150 characters; bar titles can run past the length of the bar.
Assign contacts to items
To assign bars and milestones to contacts, return to grid view, select Edit Column Properties for the contact column, and add the contacts to the contact list. See Specify preferred contacts in a contact list column for more instructions.
Use timeline view
Group items on the timeline
Grouping items in a timeline helps you organize tasks thematically into horizontal lanes by assignees, teams, status, region, department, etc. Timeline view supports up to two levels of grouping; data can be grouped by any dropdown list (single-select), contact list (single-select), or symbol column. Upon loading a sheet in timeline view for the first time, grouping is applied by default, but you can adjust or remove it using the steps below.
To add grouping:
- On the toolbar, select Group.
- In each dropdown, select the column you want to group by.
Grouping is a user-specific preference. Smartsheet remembers the applied grouping for each user for each timeline.
In the group by menu, if you have at least one level of grouping applied, you can toggle on or off to show empty lanes.
In order for a drop-down value or contact to appear as a lane when grouping, you must add the value or contact to the column’s properties.
Uncategorized lane
When applying grouping, you can choose to show or hide the uncategorized lane by toggling the Group toolbar button. Like other grouping settings, preferences for the uncategorized lane are saved per user for each timeline.
Item hierarchy
A dropdown arrow next to the item title denotes whether that item has subitems in the same grouping lane. Hierarchy is respected on timeline view; parent items appear above their child items.
To add a child row directly on the timeline, select the item on the timeline, and then select Add child item from the menu.
Timeline view retains the expand and collapse states for each user, each timeline, and each respective sheet. This data is stored within your browser’s site data and cookies. If you clear your cookies, you’ll lose the saved expand and collapse settings across all sheets. When reopened, all sheets will default to a fully expanded hierarchy.
Select the drop-down arrow on any parent item to view any direct child items. You can also use Expand all in view or Collapse all in view in the item menu to view or hide all hierarchical relationships between items.
When parent bars are collapsed, their direct child milestones remain visible and are displayed on the bar.
Timescale controls
Customizing the timescale allows you to focus on the most relevant time period for your project, whether it's a detailed daily view for short-term planning or a broader yearly overview for strategic planning. The dropdown in the toolbar allows you to change the timeline to show days, weeks, months, quarters, or years. You can also zoom in or out of the timeline using the toolbar controls and jump to today by selecting the Today button.
If you have a start of fiscal year month or start day of week set in Gantt view project settings, then timeline’s timescale will reflect these configurations. To edit either of these settings, navigate to Gantt view project settings.
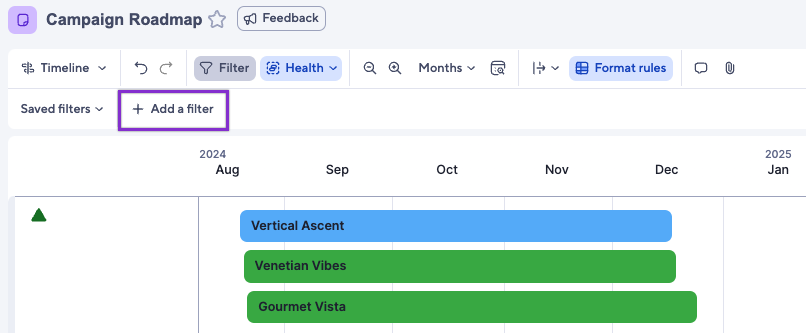
Filters in timeline view
Applying and managing filters in timeline view enables you to focus on specific tasks or team members, helping you to streamline discussions and keep attention on high-priority items. Filters applied in grid, card, Gantt, or calendar view are automatically applied when you switch into timeline view, and vice versa. Select the filter icon to turn on or off filters for the sheet.
In the timeline view toolbar, you can select any existing filter, switch between filters, or turn filters off. You can also further filter your data by applying additional filters on top of your saved filters. You can save these new filters and share them as needed. Use the X icon to remove these additional filters as needed.
Attachments in timeline view
Centralizing attachments and comments in timeline view keeps all related project information in one place, reducing the need for back-and-forth emails and ensuring that team members have easy access to essential documents and discussions.
To open the attachments panel in timeline view, select the paperclip icon in the toolbar or while hovering over an individual timeline item. In the panel, select Add to upload an attachment from your computer or a URL. You can also drag and drop files into the attachments panel.
You can use the drop-down menu to view attachments for the specific timeline item or the entire sheet. Use the actions menu to open the attachment in a new tab, download the file, edit the description, rename the file, upload a new version, view the version history, or delete the attachment.
Share your timeline
Sharing your timeline ensures that collaborators are always up to date with the most relevant project view, which fosters better communication, transparency, and alignment within your team. You can share your sheet with collaborators directly from timeline view. You can set timeline as a default view with a specific filter applied
- In the sheet, select Share in the upper right.
- Insert any people or groups as needed.
- Select Edit next to Default view.
- In the Filter dropdown, add a filter if necessary.
- In the View dropdown, select Timeline view.
- Select Save.
- Select Share or Copy link
You can also send users a link to a specific item. Right-click on an item, then select Copy item link to share a direct link.
Collaborate with others
You can comment on individual timeline items or on the sheet as a whole. Hover your mouse over the timeline item, and select the comment icon at the bottom of the popout menu to open the conversation panel for that particular item. Use the drop-down option to select All to switch to see comments for the entire sheet. Add comments and tag other users to collaborate on the item(s).
You can see changes made by other users – specifically newly created, updated, and deleted items – in timeline view as they happen in real-time. The other users viewing or editing the sheet are listed in the top right corner. Hover over their account photo to see their contact information.
Users viewing the sheet in timeline view can see all other users regardless of the view they are using. Users viewing the sheet in grid, card, calendar, or Gantt view are not able to see users viewing the sheet in timeline view.
Timeline view limitations
Timeline does not render when there are more than 5000 items in a given time window. To reduce the number of items in your timeline, zoom in using the Days timescale.
Timeline view is under active development, and new functionality will continue to be introduced over time. Your feedback can help us shape the evolution of this product. Please share your feedback with us directly using the Product Feedback Form.
Frequently asked questions
What columns can you group by?
It’s currently only possible to group by dropdown list (single-select), contact list (single-select), and symbol column types.
Is it possible to display additional columns on bars?
No, this is not currently supported.
How do I manually color bars or add conditional coloring?
Timeline displays any manual and conditional formatting colors that have been set in grid, card, Gantt, or calendar view. Ensure that task bar colors are being set on your items. It is not possible to edit conditional formatting or manual colors directly from timeline. Return to grid view to do so.
What is the difference between timeline and Gantt views?
Timeline view differs from Gantt view in that it maximizes page density – putting items side by side when possible – and allows you to visually group items thematically into horizontal lanes.
Use timeline view when planning and managing roadmaps, portfolios, projects, and communicating their progress to stakeholders. Use Gantt view to break complex projects into simple tasks, define and track dependencies, work with baselines, and identify critical paths.