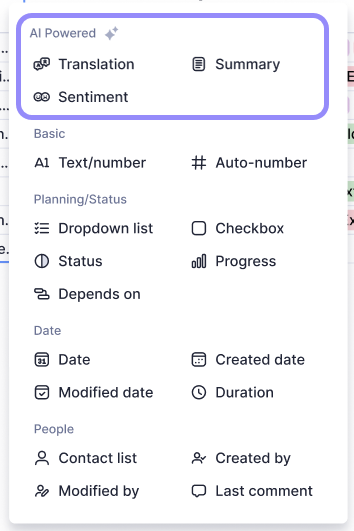
Smart Columns automate data processing by quickly summarizing text, detecting sentiment, and bridging language gaps, transforming complex data into actionable insights.
USM Content
Table view is newly released and continues to evolve. We're actively improving it, so stay tuned for updates and enhancements.
Only Admins can add and configure Smart Columns.
Smart Columns use generative AI to eliminate the need for manual data processing. They transform dense data into concise summaries, detect sentiment to highlight potential project risks, and bridge language gaps for global teams. By automating these tasks, you can shift your focus from manual data entry to high-level strategic analysis.
Learn more about the AI models that we leverage in our AI data security whitepaper.
When to use Smart Columns
Use Smart Columns to automate data processing and gain instant insights from your sheet content without manual analysis. Here are some examples of when to use Smart Columns:
- Summarize: Condense long status updates and interview notes for quick review. Use it for field and support ticket triage to distill complex issues into actionable briefs, or to normalize messy data for consistent downstream reporting.
- Translate: Bridge language gaps by instantly converting foreign feedback or documentation submitted by team members, ensuring global workforce support and enablement, enabling teams to access the same information in their preferred language.
- Sentiment analysis: Detect the emotional tone of sheet content to flag project risks. This allows for customer feedback triage at scale, helping teams prioritize urgent negative feedback and measure campaign reception at a glance.
There are three types of Smart Columns:
Translate column
Use the translate column to automatically convert any column to a supported language, making collaboration easier for your team and improving alignment.
The selected content can only be translated into one of the following languages: English, French, German, Spanish, Portuguese, Italian, Dutch, Russian, Chinese (simplified and traditional), Japanese, Korean, Arabic, and Hindi.
Add translation column
- Follow the steps to insert a column and select the column type Translation.
- In the column properties menu, choose:
- Column name.
- Column description (optional).
- Column type: AI Translation is the chosen type.
Translate: Select the row or column you want to translate.
Keep in mind that you can choose a whole row, one column, or multiple columns.
- Language: Select the language you wish to translate to.
- Additional instructions (optional): Add a prompt to personalize the translation output. For example, Translate into English and ensure the output has a professional tone.
- Select Apply.
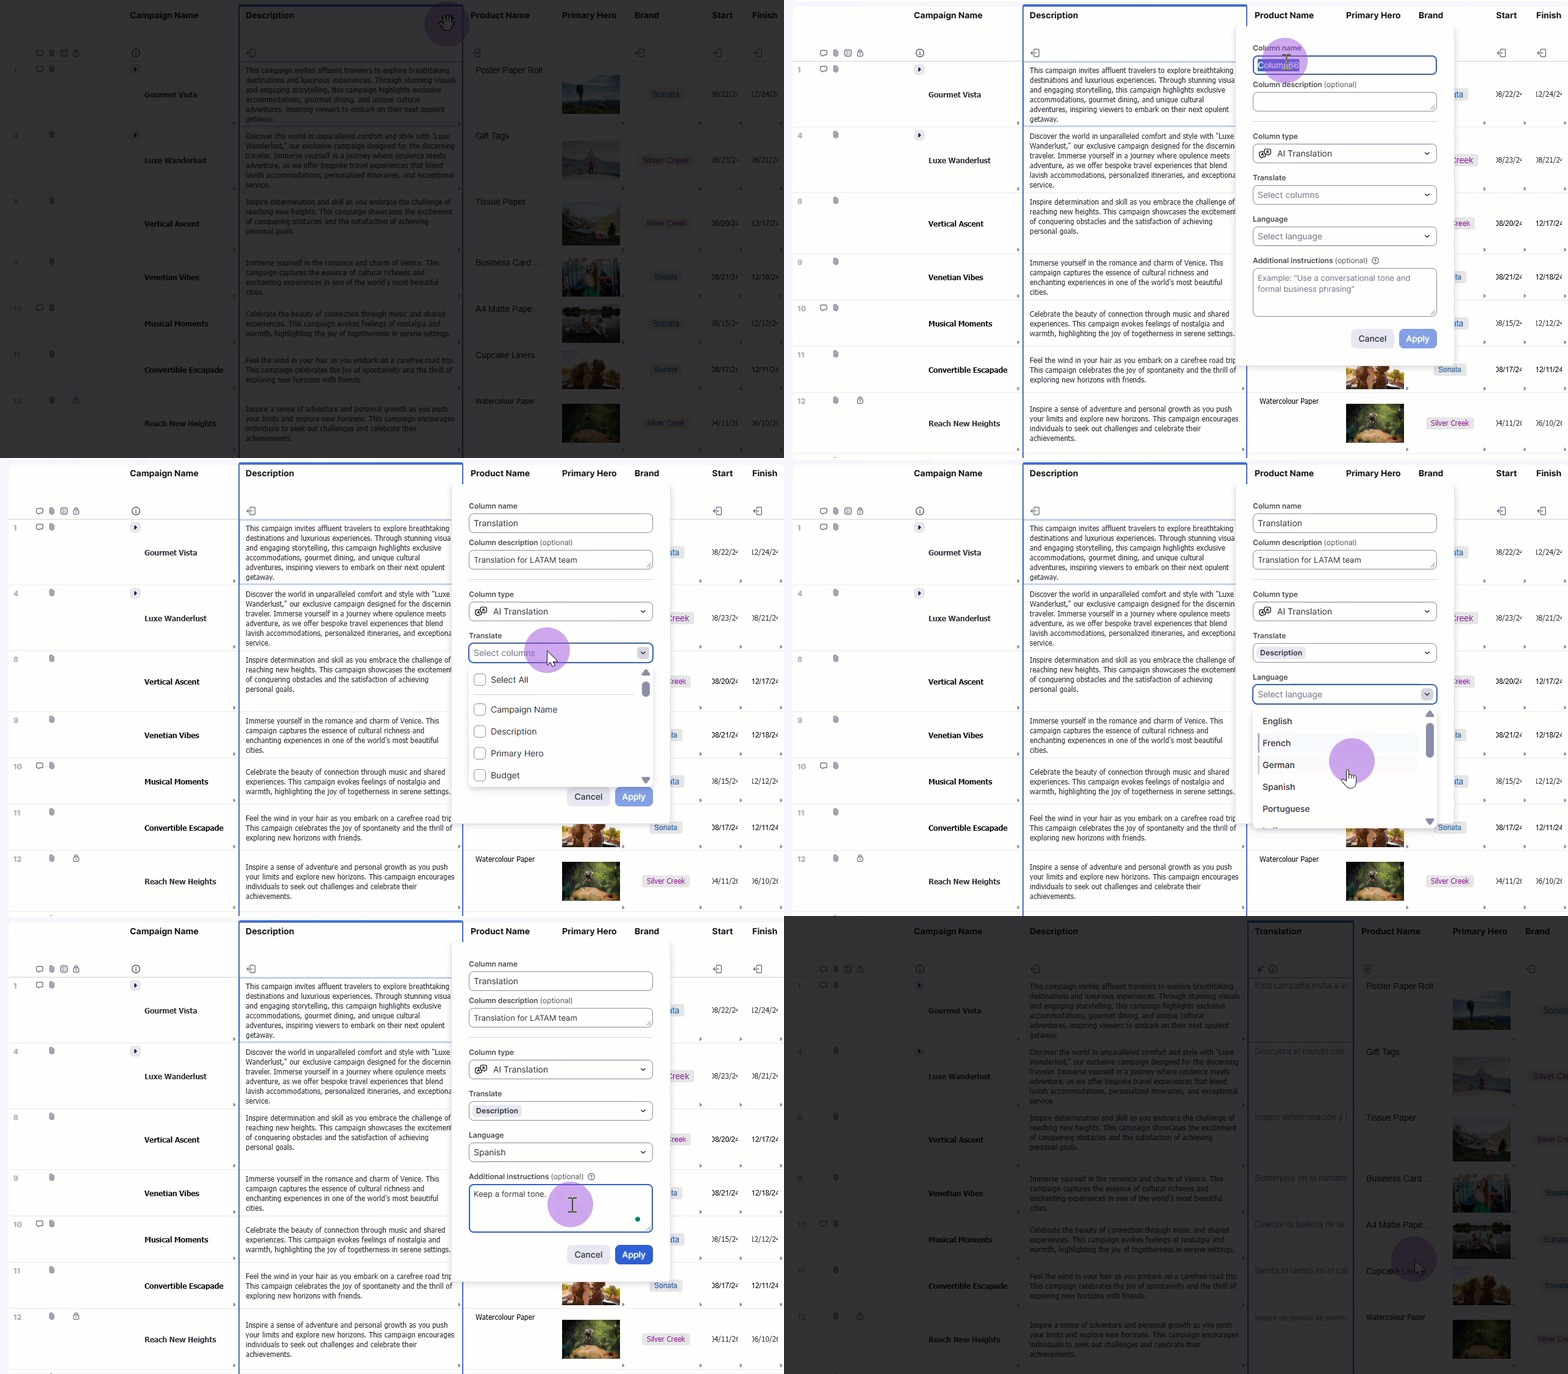
The data in the translation column works as any system column, meaning you can select, copy, paste, and apply formatting to the values from the cells or the entire column.
For now, users have to manually refresh the translation column when new updates are added.
Summary column
Use the summary column to distill large amounts of text into concise, actionable snippets. This enhances communication by reducing time spent and improving alignment through consistency and a simplified data view.
Add a summary column
- Follow the steps to insert a column and select the column type Summarize.
- In the column properties menu, choose:
- Column name.
- Column description (optional).
- Column type: AI Summary is the chosen type.
Summarize: Here, select the row or column you want to summarize.
Keep in mind that you can choose a whole row, one column, or multiple columns.
- Additional instructions (optional): Add a prompt to personalize the translation output. For example, keep the summary under 100 words and exclude any email addresses.
- Select Apply.
Sentiment analysis column
Use the sentiment analysis column to measure the emotional tone (positive, neutral, or negative) of written responses, making it easier to identify trends.
Add a sentiment analysis column
- Follow the steps to insert a column and select the column type Sentiment.
- In the column properties menu, choose:
- Column name.
- Column description (optional).
- Column type: AI Sentiment Analysis is the chosen type.
Analyze: Here, select the row or column you want to summarize.
Keep in mind that you can choose a whole row, one column, or multiple columns.
Assigned Labels: You can customize the label names and colors.
It’s recommended to limit the number of labels to five to maintain data quality.
- Additional instructions (optional): Add a prompt to personalize the translation output. For example, Count Ok as neutral.
- Select Apply.
You can use filters to create customized views for each sentiment.
You now know how to use Smart Columns to automate data processing, allowing you to summarize complex information, detect sentiment, and translate content across your sheets with ease.