
Чтобы изменить параметры проекта, следуйте этим пошаговым инструкциям.
В Smartsheet есть все необходимые инструменты для управления проектами. С их помощью ваши команды смогут выполнять совместную работу быстро, сохраняя при этом ответственность за совершаемые действия и успешно выполняя поставленные задачи.
Изменение параметров проекта
В параметрах проекта можно персонализировать такие аспекты таблицы, как рабочее и нерабочее время, параметры отображения диаграмм Ганта и управление ресурсами.
Доступ к параметрам проекта
Щёлкните правой кнопкой мыши название любого столбца в представлении сетки или Ганта и выберите Изменить параметры проекта.
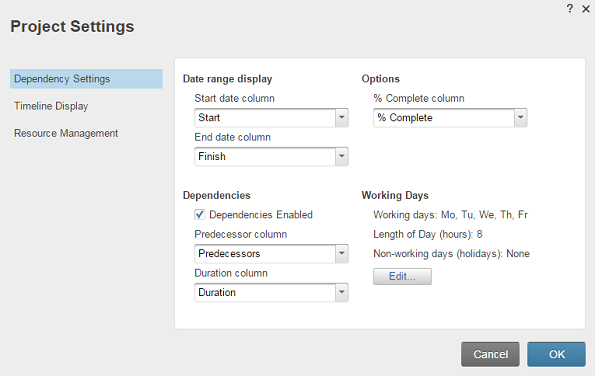
Появится форма Параметры проекта.
ПРИМЕЧАНИЯ.
- Раздел Отображение временной шкалы доступен только в представлении Ганта.
- Раздел Управление ресурсами доступен только для планов «Бизнес» и «Корпоративный». Не знаете, какой у вас тип плана? См. статью Определение плана и типа пользователя Smartsheet.
Изменение параметров зависимостей и рабочих дней
Отображение диапазона дат
Столбец дат начала или окончания — при использовании нескольких столбцов дат вы можете выбрать столбцы, которые будут использоваться для отслеживания дат начала и окончания. Эти столбцы необходимы для добавления диаграммы Ганта в таблицу, а также при использовании функции зависимостей.
Параметры
Столбец «% выполнено» — чтобы наложить на полоски задач индикаторы процента выполнения в диаграмме Ганта и просмотреть автоматическое вычисление процента выполненной работы в родительских (сводных) строках, выберите столбец таблицы, содержащий соответствующую информацию.
ПРИМЕЧАНИЕ. Автоматически вычисленная доля выполненной работы в родительских строках основана на значениях «% выполнения», вручную указанных в дочерних строках, а также на длительности дочерних задач.
Зависимости
Включено — установка флажка Зависимости включены добавляет в таблицу автоматическую функцию зависимостей. Функция зависимостей позволяет использовать столбцы «Длительность» и «Предшественник», исключать нерабочие дни из графика, а также использовать параметр изменения продолжительности рабочих дней (в часах). Она также обеспечивает автоматическое заполнение столбцов «Длительность», «Дата начала», «Дата окончания» и «% выполнения» во всех родительских строках, в результате чего в родительских строках отображается автоматическая сводка дочерних задач с отступами.
Предшественник — выберите в таблице столбец, который необходимо использовать в качестве предшествующего. Используйте выбранный столбец для создания зависимостей между задачами в расписании.
Столбец длительности — выбранный столбец длительности будет использоваться в сочетании с настроенными рабочими днями для автоматического планирования дат начала и окончания задач.
Рабочие дни
Рабочие и нерабочие дни — после включения зависимостей в таблице можно использовать кнопку Изменить, чтобы выбрать для проекта дни недели, считающиеся нерабочими. Эти параметры переопределяют глобальные параметры учётной записи. Дополнительные сведения о влиянии этих параметров на автоматическое планирование см. в статье Назначение рабочих, нерабочих и праздничных дней в таблице проекта.
Продолжительность дня (в часах) — настройка продолжительности рабочих дней (в часах) в таблице проекта. В Smartsheet по умолчанию считается, что рабочий день длится 8 часов. Продолжительность каждого рабочего дня учитывается при расчёте дат выполнения задач. Например, при создании задачи с указанием даты начала и длительностью 9 часов Smartsheet по умолчанию автоматически запланирует дату окончания на следующий рабочий день. Если вы измените количество часов в рабочем дне на 9, приложение Smartsheet запланирует дату окончания задачи на тот же день, что и дата начала.
Настройка отображения и поведения диаграмм Ганта
В разделе Отображение временной шкалы в параметрах проекта можно изменить интервалы и формат отображения временной шкалы на диаграмме Ганта, начало финансового года и из какого столбца указывается информация справа от отрезков диаграммы Ганта. Например, если выбрать в раскрывающемся списке «Отображение метки» столбец «Список контактов», рядом с полосками будут отображаться имена людей, которым назначены задачи.

Установите флажок Открыть на текущей дате, чтобы быстрее просматривать текущие задачи в проекте, когда вы открываете таблицу.
Эта возможность доступна только владельцам и администраторам таблицы. По умолчанию флажок не установлен. При копировании таблицы параметр сбрасывается. Установленный флажок влияет на представление только для вас: для остальных соавторов таблица будет открываться по-прежнему. Если пользователю с правами редактора или наблюдателя нужно открыть диаграмму Ганта на сегодняшней дате, создайте отчёт в представлении Ганта и поделитесь им.
Эти пошаговые инструкции помогут вам создать вехи в таблице проекта.
Создание вехи для обозначения значимого события в проекте
Веха — это действие или событие, представляющее важное изменение или этап работы над проектом. Для вехи дата завершения совпадает с датой начала. В диаграмме Ганта веха отображается в виде серого ромба, который выровнен по указанной дате начала.
Создание вехи
-
Выберите Представление Ганта на панели инструментов, чтобы открыть таблицу в представлении Ганта или добавить диаграмму Ганта в таблицу.

-
Включите в таблице зависимости (выберите Изменить параметры проекта в правом верхнем углу диаграммы Ганта и установите флажок Зависимости включены).
- Чтобы создать веху, введите длительность задачи, равную нулю (0), и дату начала.
СОВЕТ. Чтобы создать продлённую веху, укажите длительность задачи ~0 и дату начала. В таком случае веха будет длиться один рабочий день, но в диаграмме Ганта она по-прежнему будет отображаться в виде ромба.
Функция сводки в родительских строках несовместима с вехами. Сводные значения "процентов выполнено" не рассчитываются в задачах с подзадачами, содержащими вехи с длительностью, равной нулю (0).
Чтобы настроить функцию сводки данных из родительских строк в таблице проекта, воспользуйтесь этими пошаговыми инструкциями.
Функция сводки в родительских строках
Когда в таблице проекта включены зависимости, в родительских строках автоматически выполняется сведение информации из нескольких столбцов таблицы проекта.
Родительские строки создаются путём добавления отступа к находящимся ниже строкам. Дополнительные сведения см. в статье Иерархия: отступы и выступы строк.
В поле Дата начала родительской строки автоматически устанавливается самая ранняя дата начала из всех дочерних строк. Аналогичным образом в поле Дата окончания устанавливается самая поздняя дата окончания из всех дочерних строк.
В поле Длительность родительской строки указывается количество рабочих дней между датой начала и датой окончания в данной строке. Это значение представляет весь временной диапазон, охватываемый данным набором задач (от самой ранней подзадачи до самой поздней), а не сумму длительности этих задач.
Поле % выполнено в родительской строке вычисляется как взвешенное процентное значение на основе длительности и процента выполнения в каждой дочерней строке. Таким образом, выполненные дочерние строки с меньшей длительностью будут влиять на значение "% выполнено" родительской строки в меньшей степени, чем дочерние строки с большей длительностью выполнения. Учитывая такой способ расчёта, в сводные данные родительской строки включаются только подзадачи с заполненными значениями полей Длительность и % выполнено.
-
Если зависимости включены, родительские строки в указанных выше столбцах изменять нельзя. Если вы хотите использовать собственные значения, отключите в таблице функцию зависимостей или создайте нужную формулу в одном из столбцов, который не используется этой функцией. С помощью настраиваемых формул нельзя повлиять на отображение полосок в диаграмме Ганта.
-
Родительские строки в таблицах с включёнными зависимостями всегда будут иметь серый цвет фона в представлении Ганта или календаря.
-
Хотя длительность подзадачи можно указать в различных форматах, таких как недели, полные рабочие дни (например, 4д), неполные рабочие дни (3,5д), прошедшие дни (п3д), часы (7ч), минуты (90м), секунды (500с) и миллисекунды (50000мс), в родительских строках длительность всегда отображается в неполных рабочих днях.
-
Сводные значения "% выполнено" не рассчитываются в задачах с подзадачами, содержащими вехи (длительность = 0).