Воспользуйтесь пошаговыми инструкциями, чтобы создать панель мониторинга.
Панели мониторинга — удобный инструмент для централизации всей необходимой информации и получения данных в режиме реального времени.
Панель мониторинга состоит из простых в настройке мини-приложений, в которых содержатся данные из ваших таблиц и отчётов. Панелями мониторинга можно поделиться с любыми пользователями: членами вашей команды, руководителями и даже внешними клиентами. Панели мониторинга удобно просматривать на ПК или в мобильном приложении Smartsheet.
Панель мониторинга — это простой способ предоставить заинтересованным лицам нужную информацию для принятия эффективных решений. Панели также можно использовать в качестве портала для рабочих групп, в котором централизована вся необходимая информация и ресурсы программы, процесса или команды.

Создание и изменение панели мониторинга Smartsheet
Ниже описано, как создать свою панель мониторинга и внести в неё изменения.
Создание панели мониторинга
- На левой панели навигации щёлкните значок Центра решений (плюс).
- На панели слева выберите пункт Создать и щёлкните плитку Панель мониторинга или портал.
- Введите имя панели мониторинга и нажмите кнопку ОК. Появится новая пустая панель мониторинга.
- Щёлкните значок карандаша в правом верхнем углу, чтобы изменить панель мониторинга, или выберите в меню «Изменить» пункт Изменить панель мониторинга, чтобы начать добавлять информацию на панель мониторинга. Дополнительные сведения о типах мини-приложений и их настройке см. в статье Типы мини-приложений для панелей мониторинга Smartsheet.
- После добавления мини-приложения можно изменить его размер и расположение.
- Чтобы переместить мини-приложение, щёлкните и перетащите его или вырежьте и вставьте в новом месте.
- Чтобы изменить размер мини-приложения, щёлкните и потяните его правый нижний угол.
- Чтобы сохранить внесённые изменения, в правом верхнем углу панели мониторинга нажмите кнопку Сохранить.
Внесение изменений в панель мониторинга
В левом верхнем углу в меню «Изменить» выберите пункт Параметры панели мониторинга или Добавить мини-приложение. Дополнительные сведения см. в статье Добавление мини-приложений на панель мониторинга и их обновление. Дополнительные сведения см. в статье Добавление мини-приложений на панель мониторинга и их обновление.
Настройка цвета фона для панели мониторинга
Когда в Smartsheet открыта панель мониторинга, можно выбрать для неё цвет фона: серый или белый.
Чтобы изменить цвет фона для панели мониторинга, выполните указанные ниже действия.
- В левом верхнем углу панели мониторинга щёлкните меню Изменить.
- Выберите пункт Параметры панели мониторинга. Кроме того, можно щёлкнуть правой кнопкой мыши в любом месте фона сетки и выбрать пункт Параметры панели мониторинга или щёлкнуть значок шестерёнки на панели функций справа в режиме редактирования.
- Выберите цвет фона и нажмите кнопку «Сохранить», чтобы подтвердить изменения.
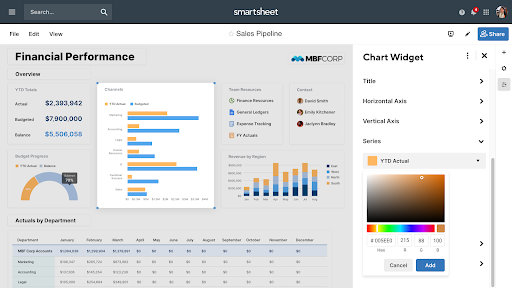
Применение пользовательских цветов
При выборе цветов для шрифтов, диаграмм, названий и т. д. вы можете выбрать один из стандартных наборов или добавить пользовательский цвет с помощью шестнадцатеричного кода, кода RGB или цветовой палитры. Чтобы создать свой собственный пользовательский цвет, выберите значок + в разделе Пользовательские цвета в палитре.
На панели мониторинга будет сохранено до 20 пользовательских цветов, поэтому, если вы добавите пользовательский цвет в мини-приложение А, вы сможете быстро выбрать его в мини-приложении В при условии, что они находятся на одной панели мониторинга.
Пользовательские цвета уникальны для редактируемой панели мониторинга и не будут видны на других панелях.
При просмотре панели мониторинга в мобильном приложении пользовательские цвета будут заменены ближайшим доступным цветом по умолчанию.
Настройка частоты автоматического обновления панели мониторинга
По умолчанию панель мониторинга автоматически обновляется каждые 10 минут.
Чтобы изменить частоту или отключить автоматическое обновление, выполните указанные ниже действия.
- В левом верхнем углу откройте меню Просмотр.
- Наведите указатель мыши на пункт Автообновление.
- Выберите нужную частоту или вариант Выкл., чтобы отключить автоматическое обновление.
Помните о перечисленных ниже моментах, связанных с автоматическим обновлением.
- Вы можете изменить параметры автоматического обновления панели мониторинга только для своих сеансов работы с ней. Например, если отключить автоматическое обновление, оно будет по-прежнему активно для других соавторов, которые просматривают эту панель мониторинга.
- Опубликованная панель мониторинга будет автоматически обновляться каждые 10 минут. Такое поведение невозможно изменить или отключить.
Мини-приложения для веб-контента не будут автоматически обновляться на панелях мониторинга.
Ознакомьтесь с видами мини-приложений для панели мониторинга.