Learn more about the different types of reports available in Resource Management including:
- Time and fees reports
- Expense reports
- Budget reports
- Utilization reports
- Leave reports
- Scheduled hours reports
Create a time and fees report
Time and fees reports pull data from your selected metrics: hours, days, amounts, amounts & hours, or amounts & days.
Create a time and fees report
- Select Reports.
- Select New Report.
- On the right sidebar, select View, then Time & fees.
Select Time Frame and the appropriate option
If you select a time frame relative to today, the report will be dynamic and continue to show data with respect to the current date. If you want a set time range, select Custom Date Range.
- Set your first and second group by options if needed.
- Set any necessary filters.
- Select Run report.
The projects visible vary by permission level. For example, Project Editors can only see projects they own.
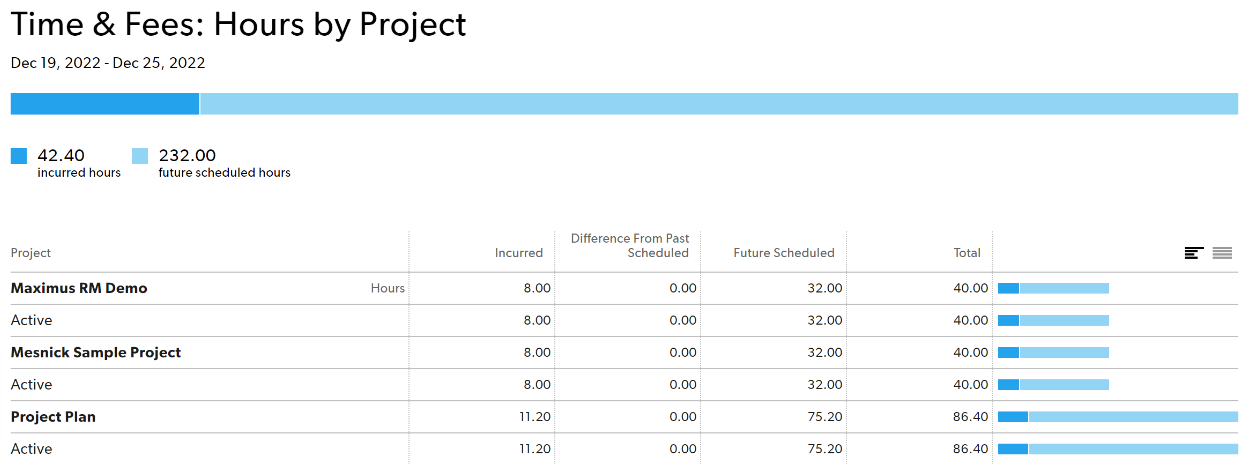
Time and fees report columns
| Column | Description |
|---|---|
Selected Groupings | Select a row to see individual time entries under each group. |
Bill Rates | If you chose amounts when you set up your report, you can see the Bill Rate column. This column shows a person’s applied bill rate for the hours worked on a project. Sometimes reports show groups where multiple bill rates are included – for example, when grouping by discipline. |
Incurred | The actual amount already incurred on the project. Your account settings determine if this includes both confirmed and unconfirmed hours. Future time does not appear as incurred time on reports. |
Difference from past scheduled | Shows the difference between incurred time or money and the original plan. For example, if a person was originally scheduled to work on a project for four hours on a given day, but they confirmed five hours, the difference from past scheduled column shows +1. |
Future scheduled | Time or money scheduled in the future. |
Remaining | The amount of time or money still available for the project. |
Chart | The chart allows you to compare the incurred, difference, and future scheduled against each other. |
When you export a summary report CSV, the order of the columns could change, and any filters applied will show up in the CSV as well.
Example uses for time and fees reports
Create a revenue forecast by time and budget
- View: Time & fees: Amounts & hours
- Time frame: Next 30 days
- First group by: Client
- Then group by: Project
- Show: Everything
Create an unconfirmed hours report
Unconfirmed time reports are useful if your organization tracks time. This report will show who hasn't entered or confirmed their time for the given time period.
Here are the settings for an unconfirmed time entries report.
- View: Time & fees: Hours
- Time frame: Last week
- First group by: Entry type
- Then group by: Team member
- Show: Entry type: Unconfirmed
Create an hours summary by department report
- View: Time & fees: Hours
- Time frame: Last month
- First group by: Discipline
- Then group by: Team member
- Show: Everything
Create a report for incomplete timesheets
To see a report for people who have not updated their timesheets, review unconfirmed time for the week. To see who has updated their time sheets, review confirmed hours.
- View: time and fees (hours)
- Time frame: this week (or whatever duration is desired)
- First group by: team member
- Then group by: project
- Show: time entry type: unconfirmed
If you have the Advanced reports feature, you can utilize the missing timesheets Smartsheet report to analyze and communicate this information.
Create a leave report
The leave report shows you all leave incurred (already taken), the difference (unplanned and taken leave), and future scheduled (planned on the schedule for the future) for the time period you selected.
- View: time and fees (Hours or Days)
- Time frame: this week (or whatever duration is desired)
- First group by: Leave Type
- Then group by: Team Member
- Show: Leave Type (select any you want to see in the report)
Create a scheduled hours report
In a scheduled hours report, you can see the hours each person was scheduled for the specific project.
- View: time and fees (Hours)
- Time frame: this week (or whatever duration is desired)
- First group by: Team Member
- Show: Project (Select the specific projects you want to see)
Advanced reports
If your organization has a Business or Enterprise Smartsheet plan and uses Smartsheet authentication, then you can further analyze and share the data from your time and fees report in Smartsheet. When you create an advanced report from a time and fees report, multiple Smartsheet assets are created for you, including:
- Source sheet
- Time and fees report
- Missing Timesheets report
- Dashboard
The missing timesheet report displays the list of team members who haven’t submitted any time for a given week for the past 90 days. This report determines submission status using a calculated submission status column in the underlying data sheet. That column’s formula returns the following values:
- Not Entered: The resource didn’t enter any time for the week
- Rejected: The resource has one or more rejected entries for the week
- Submitted: The resource has at least one pending or approved entry for the week
- Unsubmitted: The resource confirmed at least one entry for the week, but never submitted for approval
You can modify the submission status column formula if your organization has different rules for missing timesheets (i.e. a resource must submit time for each workday to avoid counting their timesheet as missing).
Learn more about the advanced report and the associated Smartsheet assets.
Create an expense report
Expense reports can help your organization track various costs, such as those incurred when hiring outside vendors, ordering prototypes, or traveling.
Create an expense report
- Select Reports.
- Select New Report.
- On the right sidebar, select View, then Expenses.
Select Time Frame and the appropriate option
If you select a time frame relative to today, then the report is dynamic and will continue to show data with respect to the current date. If you want a set time range, select Custom Date Range.
- Set your first and second group by options if needed.
- Set any necessary filters.
- Select Run report.
The projects visible vary by permission level. For example, Project Editors can only see projects they own.
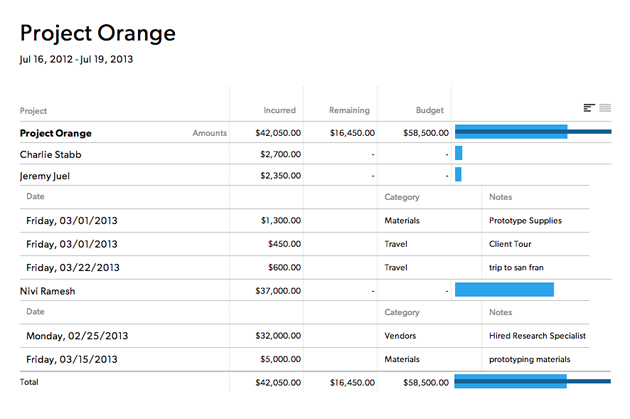
Expense report columns
| Column | Description |
|---|---|
Project Name | Select the project name to expand child rows and see more information about the project.
|
Incurred | Amount already expensed |
Remaining | Amount still available for project expenses |
Budget | Project expense budget. This number is set in project settings. |
Category | The category column appears when you select the project name to display more information. The expense category identifies the type of purchase, for example, travel. |
Notes | The notes column appears when you select the project name to display more information. Notes describe the expense. |
Chart | The chart shows graphically how much of the budget you have spent. |
Exporting the underlying report data to CSV includes the expense budget items. When you export a summary report CSV, the order of the columns could change, and any filters applied will show up in the CSV as well.
Example use for expense reports
Project budget expense report
- View: Expenses
- Time Frame: Custom Date Range
- First Group By: Project
- Then Group By: Team Member
- Show: Project: Project Name / Client: Project Client
Advanced reports
If your organization has a Business or Enterprise Smartsheet plan and uses Smartsheet authentication, then you can further analyze and share the data from your expense report in Smartsheet. When you create an advanced report from an expense report, multiple Smartsheet assets are created for you, including:
- Source sheet
- Expenses report
- Expenses report by category
- Dashboard
The expenses by category report shows project expenses grouped by expense category.
If a customer doesn’t have the resources to categorize their expense entries, this report can be modified or deleted. If it is deleted, the related dashboard should be updated to remove the related charts.
Learn more about the advanced report and the associated Smartsheet assets.
Create a budget report
Budget reports pull data for the entire project and give you a complete overview of the project status. You can view a budget report in hours, days, or amounts
Budget reports include time entries for projects outside the time frame of the report. Budget reports always show the total budgets for projects that have any data within the time range you have selected. This is intentional, as budget reports are designed to give you a holistic, high-level overview of how your projects are tracking against their entire time/fee budget. Otherwise, your project might appear to be on track because you’re not counting hours for that time frame.
If you only want to see hours for a selected time frame, switch to a time and fees report.
Create a Budget report
- Select Reports.
- Select New Report.
- On the right sidebar, select View, then Budget.
Select Time Frame and the appropriate option
If you select a time frame relative to today, then the report is dynamic and will continue to show data with respect to the current date. If you want a set time range, select Custom Date Range.
- Set your first and second group by options if needed.
- Set any necessary filters.
- Select Run report.
The projects visible vary by permission level. For example, Project Editors can only see projects they own.
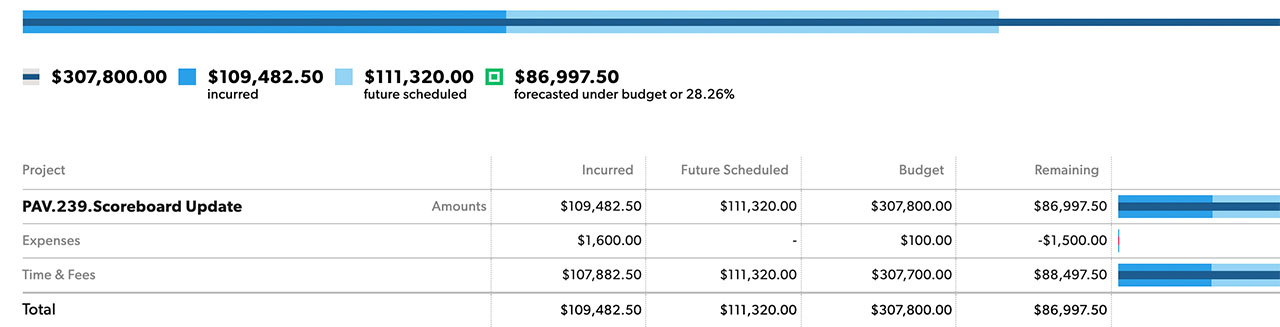
Budget report columns
| Column | Description |
|---|---|
Project Name | The names of the Projects that fit in the grouping and filters. You can select the project name to see the individual entries or expenses. |
Incurred | The actual amount of time already worked or money expensed for the project. Expenses with a future date will still appear in the Incurred column because the money for the expense has already been set aside. |
Future Scheduled | The amount of time or money scheduled in the future. |
Budget | Project budget. It is a fixed amount predetermined in project settings. |
Remaining | The amount of time or money still available for the project. |
Chart | The chart shows you the incurred and remaining amount compared to the total budget. |
Example uses for budget reports
Project status budget report
- View: Budget: Amounts
- Time Frame: Custom Date Range
- First Group By: Project
- Then Group By: Team Member
- Show: Project: Project Name / Client: Project Client
Advanced reports
If your organization has a Business or Enterprise Smartsheet plan and uses Smartsheet authentication, then you can further analyze and share the data from your budget report in Smartsheet. When you create an advanced report from a budget report, multiple Smartsheet assets are created for you, including:
- Source sheet
- Budget report
- Dashboard
Learn more about the advanced report and the associated Smartsheet assets.
Create a utilization report
Utilization reports allow you to see historic utilization based on incurred hours and forecasted utilization based on future scheduled assignments. The utilization rate is based on the availability of the person within a specified time frame.
Create a utilization report
- Select Reports.
- Select New Report.
- On the right sidebar, select View, then Utilization.
Select Time Frame and the appropriate option
If you select a time frame relative to today, then the report is dynamic and will continue to show data with respect to the current date. If you want a set time range, select Custom Date Range.
- Set your first and second group by options if needed.
- Set any necessary filters.
- Select Run report.
The projects visible vary by permission level. For example, Project Editors can only see projects they own.
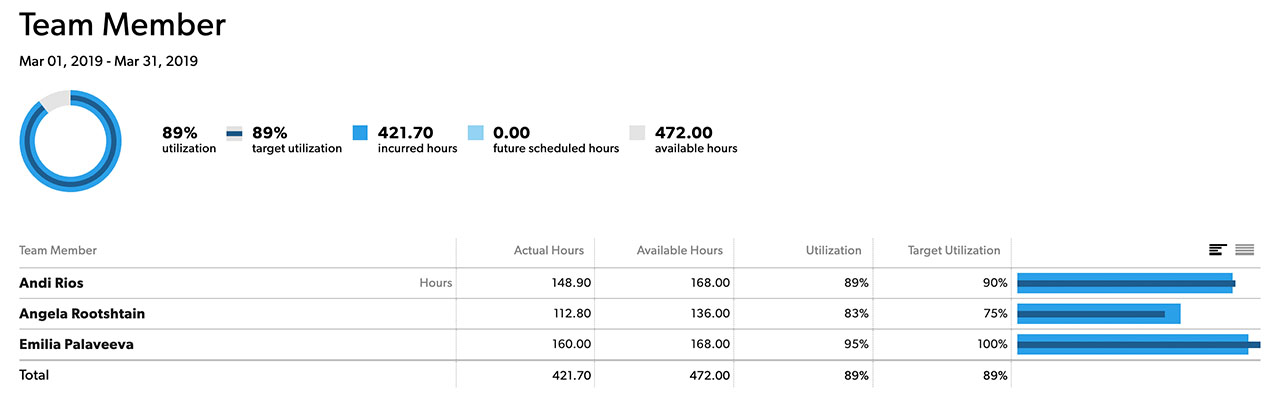
Utilization report columns
| Column | Description |
|---|---|
Team Member Name | Select the team member’s name to see a breakdown of every day for the selected time range. |
Actual Hours | Either incurred (confirmed and unconfirmed) or future scheduled hours, depending on the time frame. You may want to filter out non-billable hours. For example, you may want to omit internal projects or only include time entries for a certain category. This only works when you are doing itemized time tracking for incurred entries. |
Available Hours | Standard availability as defined within Account Settings, for example, 8 hours/day. Account-wide availability settings can be overruled by availability settings within a person's profile, for example, if someone is working part time. Employment dates, as set within a person's profile, also impact how availability is calculated. A person is only considered available between the first day of work and the last day of work as set in their profile settings. |
Utilization | Utilization calculates actual hours divided by available hours, multiplied by 100%. For example, if someone has 30 actual hours and 40 available hours, their utilization rate is 75%. |
Target Utilization | A fixed value that is set in each person’s profile. This number is used to track how utilization compares to targets for individuals or departments. |
Chart | The chart shows you the utilization compared to the target utilization. |
Calculate utilization by project
To see utilization by project, use the filters in Resource Management to only show utilization for a particular project or project type.
Advanced reports
If your organization has a Business or Enterprise Smartsheet plan and uses Smartsheet authentication, then you can further analyze and share the data from your utilization report in Smartsheet. When you create an advanced report from a utilization report, multiple Smartsheet assets are created for you, including:
- Source sheet
- Utilization report
- Utilization summary report
- High Utilization report
- Low Utilization report
- Dashboard
The high utilization report displays those with utilization at or above their target, based on a calculated met utilization column in the source sheet. It shows rows based on the primary group selection in the related report in Resource Management (e.g., team member, discipline, etc.). The low utilization report shows those below their utilization target.
The met utilization calculation can be modified to fit customer needs if they have different thresholds.
At this time, you cannot rename the Primary Group column in the source sheet. Deleting or renaming columns is not supported and will break the data workflow. However, you can work around this by:
- Create a new column in the source sheet with the desired name
- Add =[Primary Group]@row as a column formula in the new column
Learn more about the advanced report and the associated Smartsheet assets.