Utilization reports show billing efficiency for a person, department, or organization within a defined time frame.
Utilization reports allow you to see historic utilization based on incurred hours and forecasted utilization based on future scheduled assignments. The utilization rate is based on the availability of the person within a specified time frame.
Create a utilization report
- Select Reports.
- Select New Report.
- On the right sidebar, select View, then Utilization.
Select Time Frame and the appropriate option
If you select a time frame relative to today, then the report is dynamic and will continue to show data with respect to the current date. If you want a set time range, select Custom Date Range.
- Set your first and second group by options if needed.
- Set any necessary filters.
- Select Run report.
The projects visible vary by permission level. For example, Project Editors can only see projects they own.
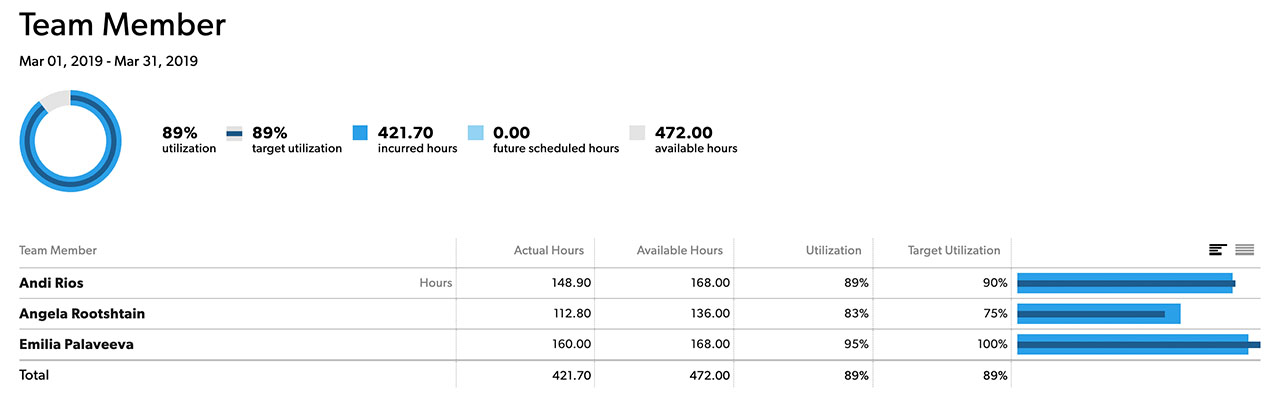
Utilization report columns
| Column | Description |
|---|---|
Team Member Name | Select the team member’s name to see a breakdown of every day for the selected time range. |
Actual Hours | Either incurred (confirmed and unconfirmed) or future scheduled hours, depending on the time frame. You may want to filter out non-billable hours. For example, you may want to omit internal projects or only include time entries for a certain category. This only works when you are doing itemized time tracking for incurred entries. |
Available Hours | Standard availability as defined within Account Settings, for example, 8 hours/day. Account-wide availability settings can be overruled by availability settings within a person's profile, for example, if someone is working part time. Employment dates, as set within a person's profile, also impact how availability is calculated. A person is only considered available between the first day of work and the last day of work as set in their profile settings. |
Utilization | Utilization calculates actual hours divided by available hours, multiplied by 100%. For example, if someone has 30 actual hours and 40 available hours, their utilization rate is 75%. |
Target Utilization | A fixed value that is set in each person’s profile. This number is used to track how utilization compares to targets for individuals or departments. |
Chart | The chart shows you the utilization compared to the target utilization. |
Calculate utilization by project
To see utilization by project, use the filters in Resource Management to only show utilization for a particular project or project type.
Advanced reports
If your organization has a Business or Enterprise Smartsheet plan and uses Smartsheet authentication, then you can further analyze and share the data from your utilization report in Smartsheet. When you create an advanced report from a utilization report, multiple Smartsheet assets are created for you, including:
- Source sheet
- Utilization report
- Utilization summary report
- High Utilization report
- Low Utilization report
- Dashboard
The high utilization report displays those with utilization at or above their target, based on a calculated met utilization column in the source sheet. It shows rows based on the primary group selection in the related report in Resource Management (e.g., team member, discipline, etc.). The low utilization report shows those below their utilization target.
The met utilization calculation can be modified to fit customer needs if they have different thresholds.
At this time, you cannot rename the Primary Group column in the source sheet. Deleting or renaming columns is not supported and will break the data workflow. However, you can work around this by:
- Create a new column in the source sheet with the desired name
- Add =[Primary Group]@row as a column formula in the new column
Learn more about the advanced report and the associated Smartsheet assets.