Applies to
- Pro
- Business
- Enterprise
Timeline, board, grid, Gantt, card, and calendar views
Views in Smartsheet allow you to see and work with your data in different ways.
You can choose between:
- Timeline view - Displays date-driven data on a timeline in organized groups.
- Board view - Displays key data in cards in vertical, dynamic lanes
- Grid view—Displays data in a spreadsheet format.
- Gantt view—Displays date-driven data in a spreadsheet on the left and a Gantt chart on the right.
- Card view—Displays data in cards organized in lanes.
- Calendar view—Displays date-driven tasks as events in a week or month calendar.
To switch between these views, use the Views buttons in the top toolbar.
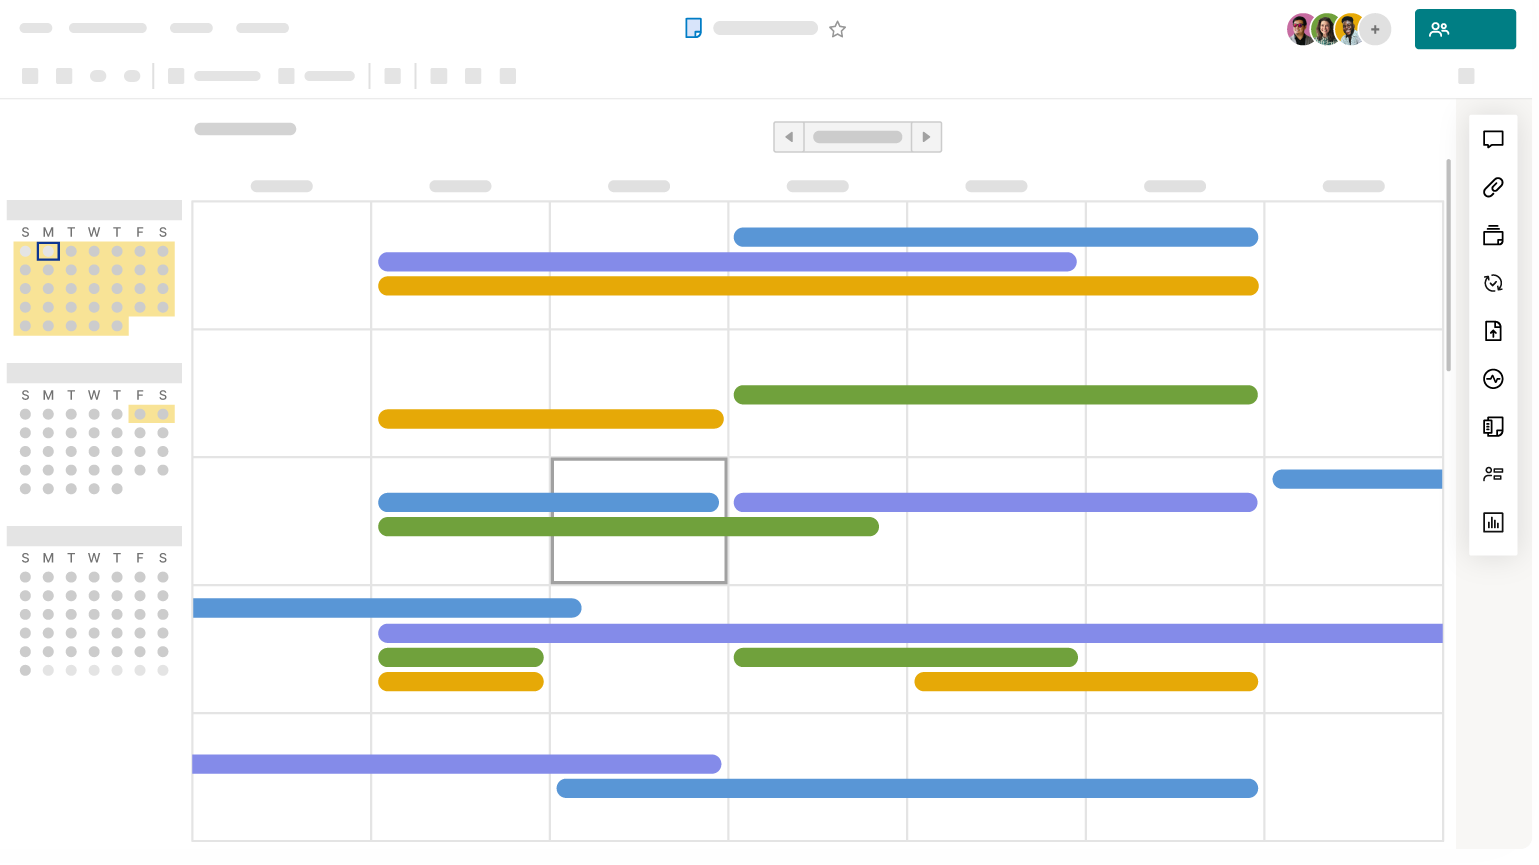
Timeline view
Timeline view lets you to arrange your date-based work on a horizontal timeline and group tasks to track project progress and communicate project status. A sheet must have at least two date columns (not backed by formulas) to use timeline view. Learn more about working with timeline view and tracking date-based work.
Timeline view is only available on Business and Enterprise plans.
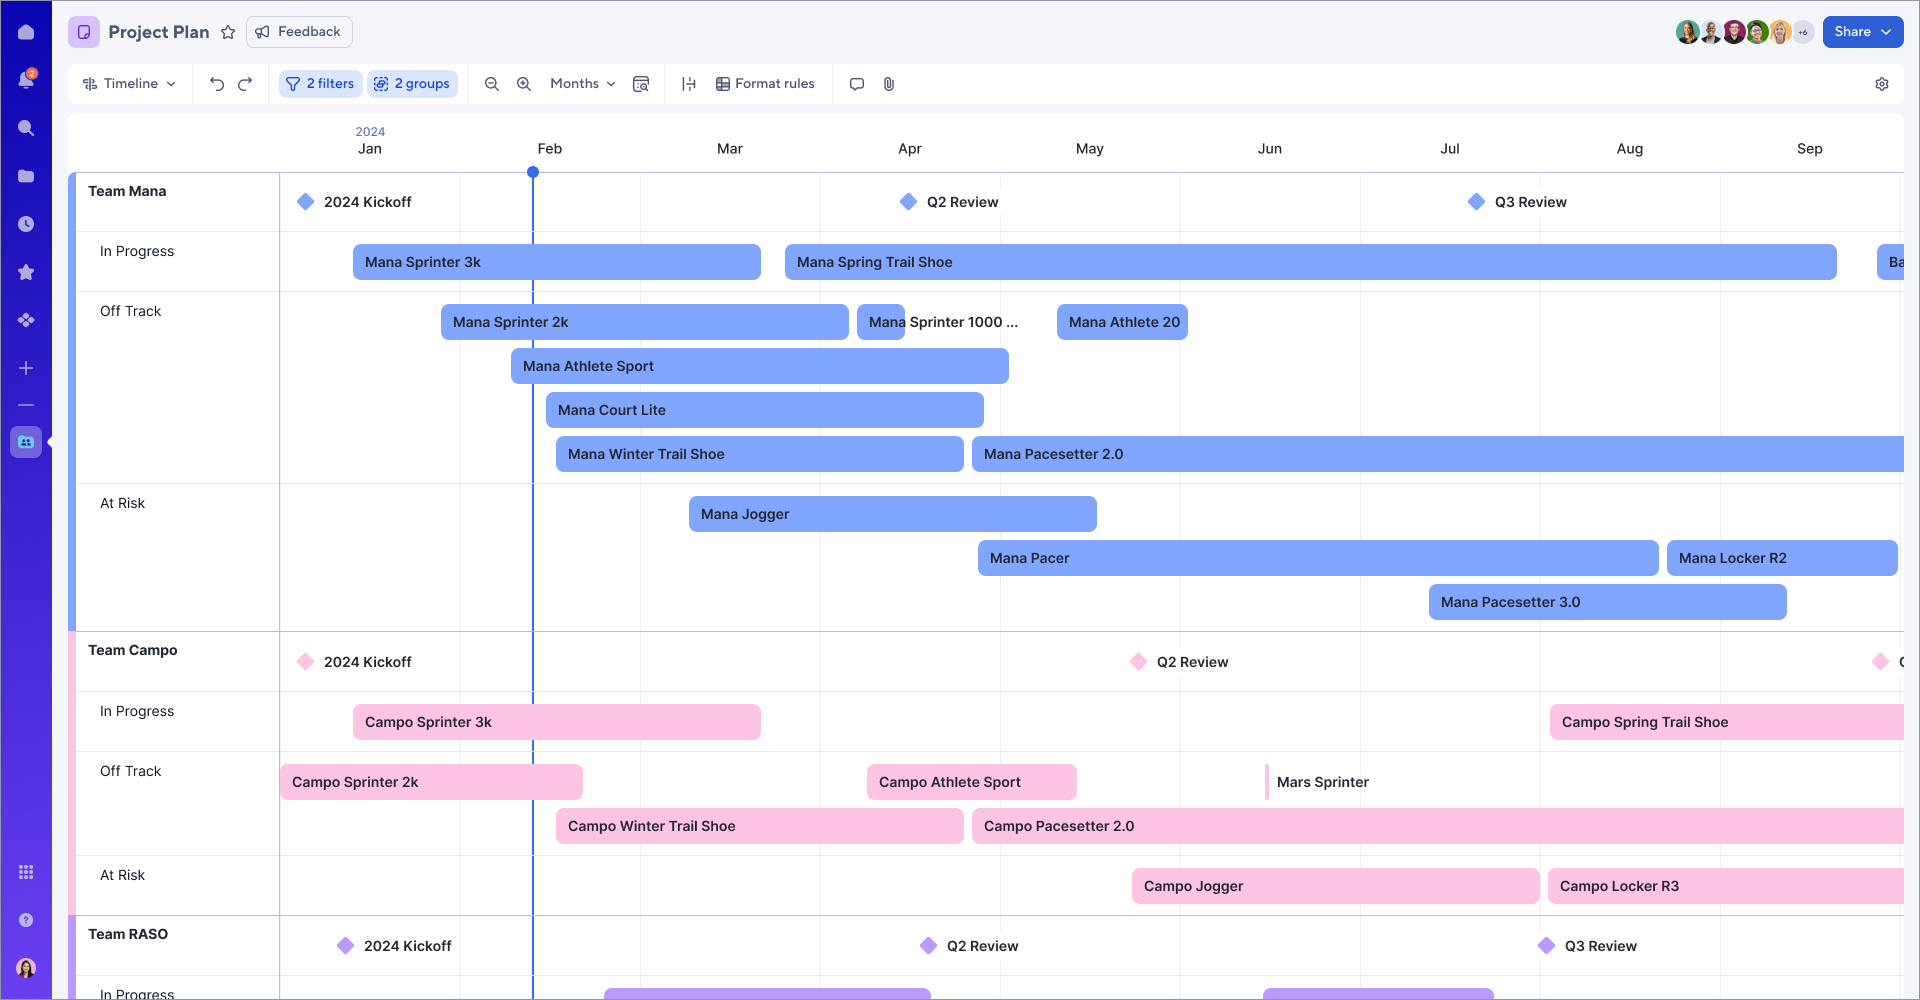
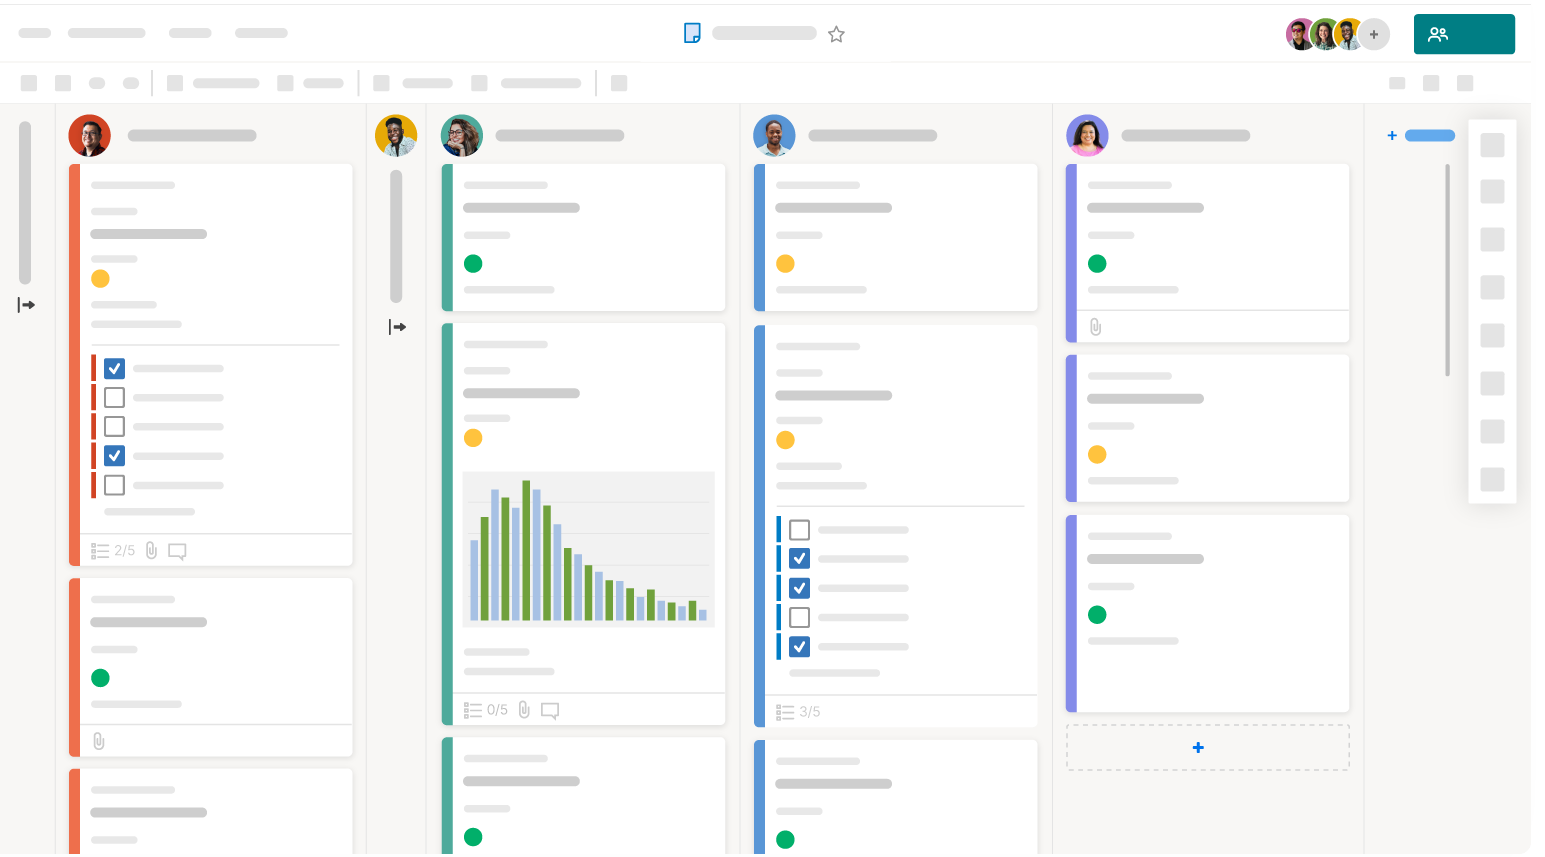
Board view
With board view, you can visually organize your projects, tasks, or cards into dynamic vertical lanes (such as by status, phase, assignee, or team). Drag and drop cards to move them across lanes, and add and update cards directly in board view. Use subtasks to visualize task relationships. See real-time changes from collaborators, such as newly added, updated, or deleted cards. Learn more about using board view to visualize your project.
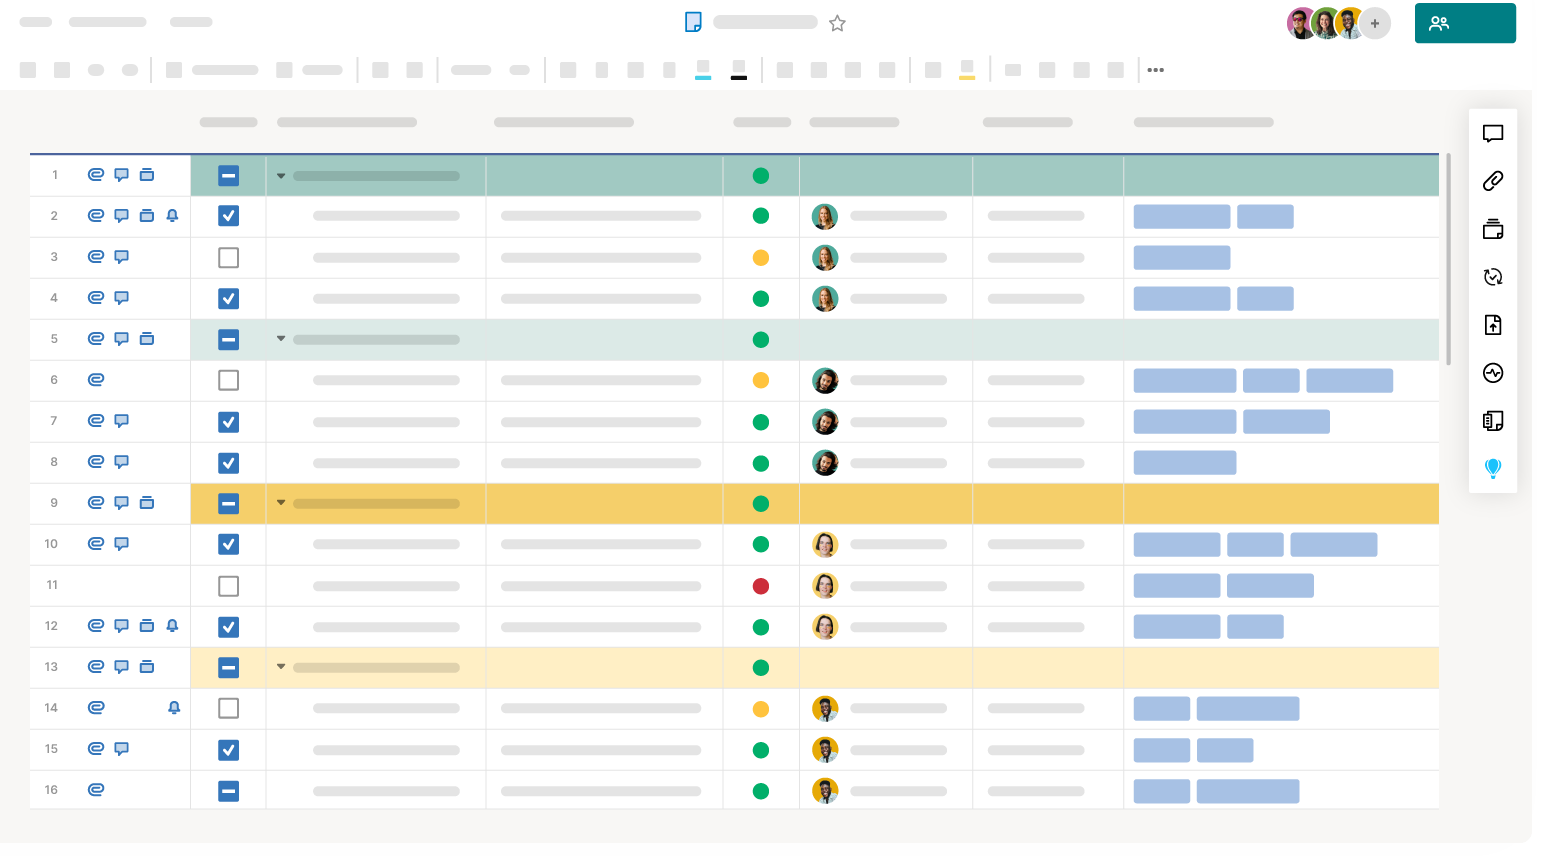
Grid view
Switch to grid view to work with your data in a spreadsheet. In grid view, you can quickly add, move, or update the columns and rows in your sheet. Learn more about inserting and deleting rows.
Grid view (as well as Gantt view) allows you to add formulas to your sheet to calculate values. Learn more about creating and Editing Formulas in Smartsheet.
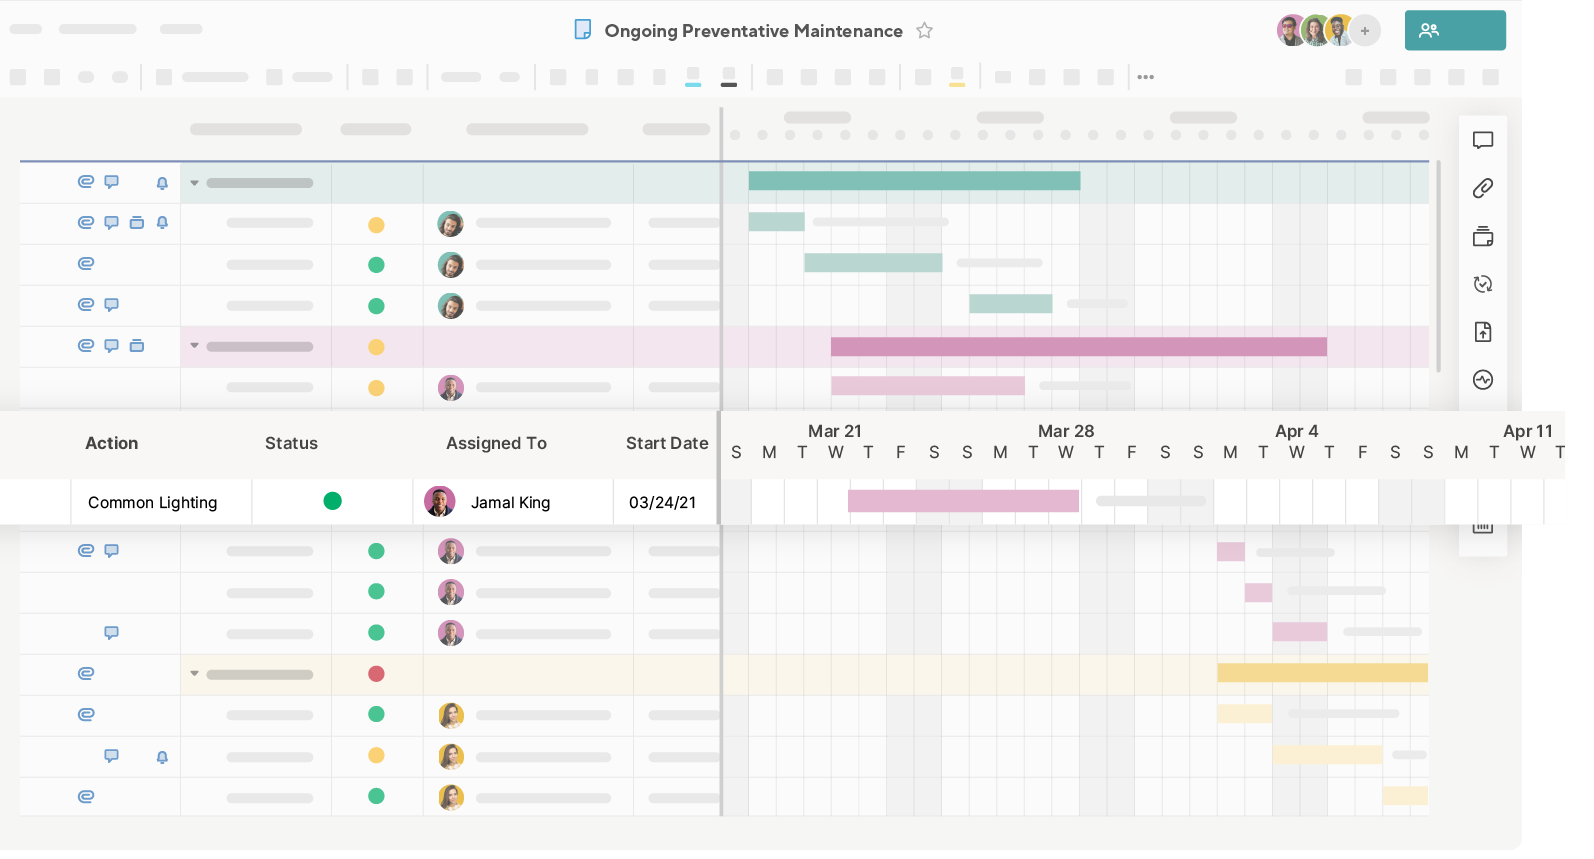
Gantt view
With Gantt view, you can see information in the grid on the left and a corresponding Gantt chart on the right. To use Gantt view, you need at least two date columns (not backed by formulas) and to configure project settings.
Gantt charts are a staple project management resource for visually tracking the duration of and relationships between tasks in a project. Learn more about working with Gantt charts.
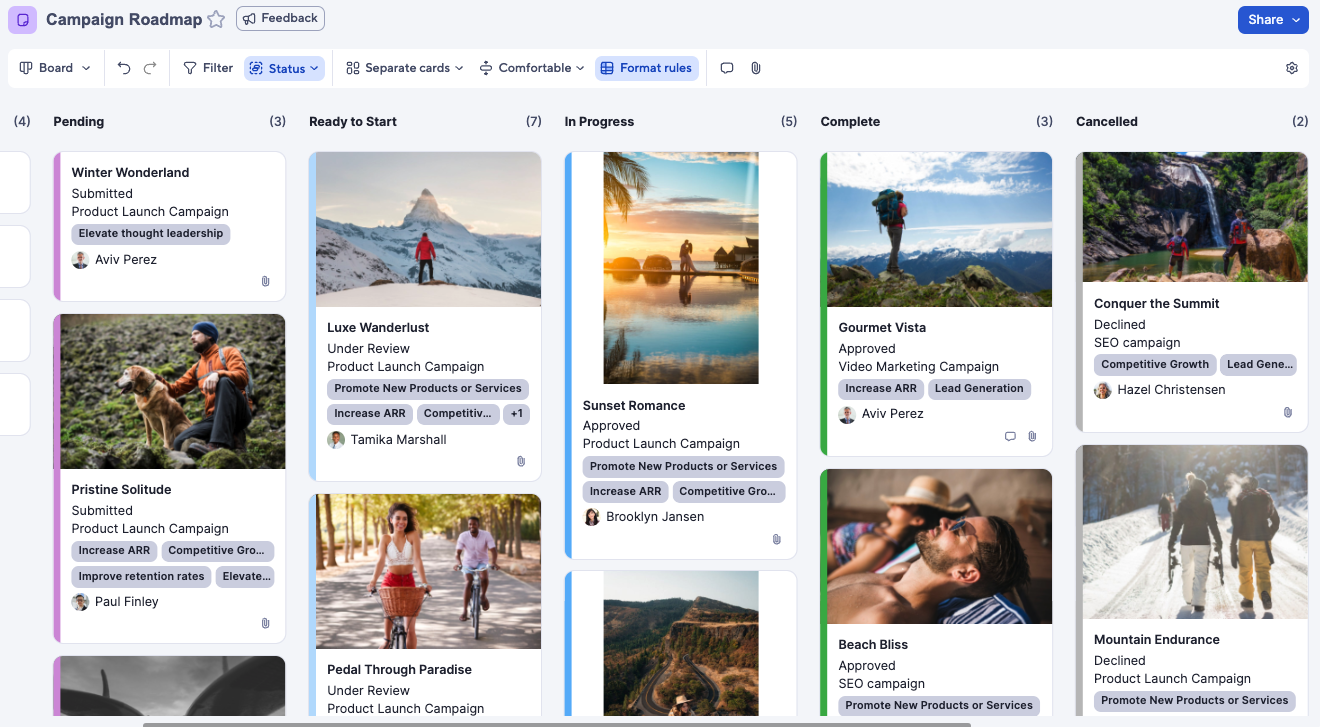
Card view
Card view displays your data in a Kanban board (typically used in agile project management). You must have at least one single-select dropdown list or contact list column to use card view. Lanes are created from the properties of the column you select as your view by criteria. Learn more about using card view to visualize your project.
Calendar view
Use calendar view to get a sense of the number of concurrent tasks you have per day in your project and to identify tasks that overlap across weeks or months. You can view any sheet with at least one date column in calendar view. Learn more about working with calendar view.