The timeline widget allows you to display timeline views in your dashboard directly from your sheets or reports, enhancing project visibility and management.
USM Content
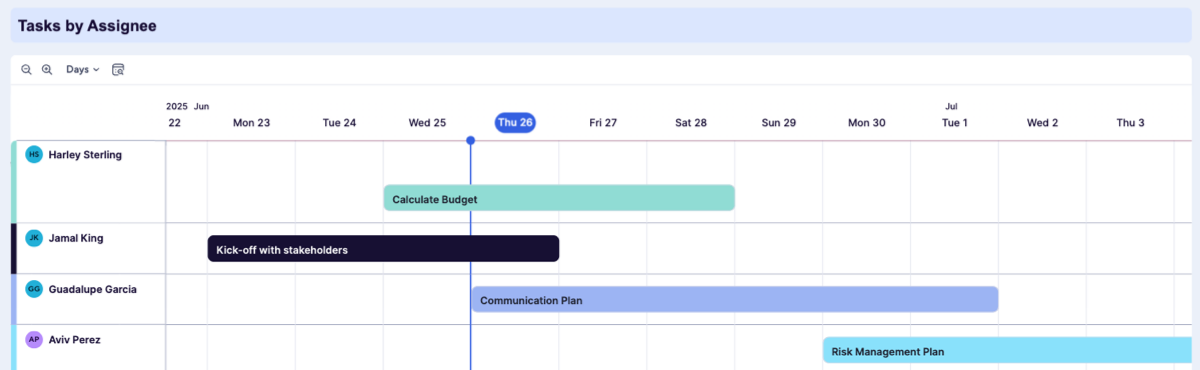
Timeline widget capabilities
Here's what you can accomplish with the timeline widget:
- Display sheet or report data as a timeline: Show tasks, milestones, and project phases from any sheet or report on your dashboard
- Filter and group data: Apply existing shared filters and group settings from your sheets to customize how you're presenting timeline data
- Adjust timescales: Switch between different timescales (days, weeks, months, quarters, years) for a broad overview or detailed view of projects
- Hover for details: Gain insights into individual tasks and milestones by hovering over them to see a detailed pop-up with relevant information
- Navigate hierarchies: Expand and collapse hierarchies in the timeline to view sub-tasks and components of projects
- Use your theme colors: Match the timeline widget to the dashboard's theme to ensure a consistent look across all reports
- Apply conditional formatting: Applying conditional formatting from sheets to timeline bars and milestones in the widget is optional, but it provides visual cues for important information
Add a timeline widget
- Navigate to the right toolbar in the dashboard editor.
- Select
 (Add Widgets).
 Select Timeline.
Brandfolder Image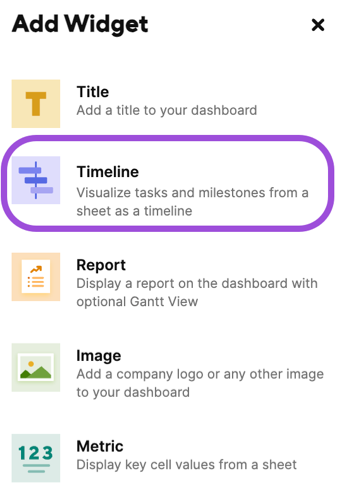
Here's another way to add a timeline widget:
- In the main toolbar of your dashboard editor, select Edit.
Select + Add Widget > Timeline.
Brandfolder Image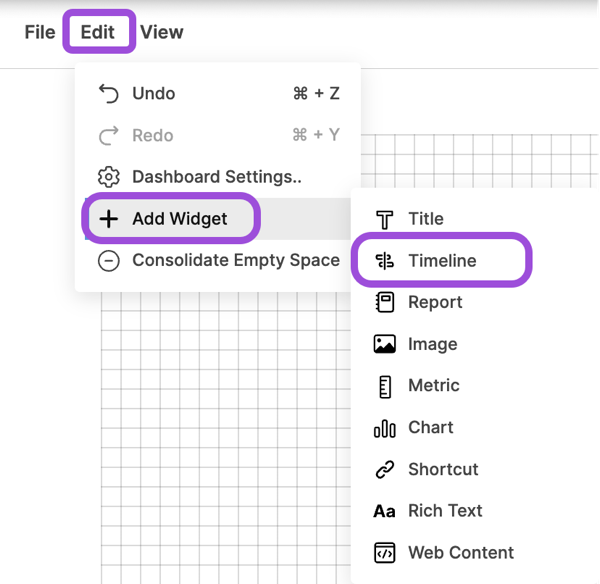
Customize your timeline widget
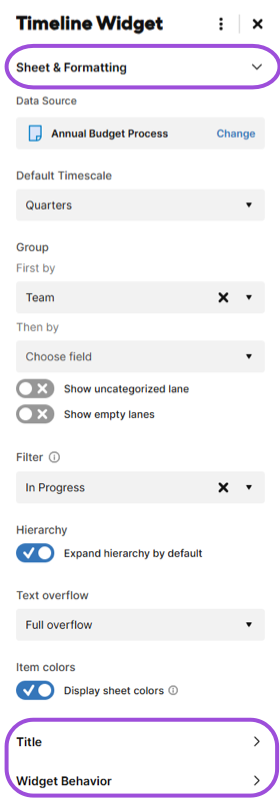
In the Timeline Widget panel, you can edit the following attributes:
- Source sheet or report
- Formatting
- Title
- Widget Behavior
Modify how data displays
To do this | Follow these steps |
|---|---|
Change your data source |
|
Set the default timescale | Under Default Timescale, use the dropdown menu to set the timescale to:
|
Apply groups to your data | Under Groups, use the First by and Then by dropdown menus to group the data from your source sheet. You can also use the toggles to decide whether to show the uncategorized lane and empty lanes in the view. |
Change filter settings | Under Filter, search for the shared filter you want to apply to the data in your timeline widget. Keep in mind that you can only use shared filters that originate from the source sheet for your timeline widgets. |
Set the default hierarchy state | Select whether hierarchy is expanded or collapsed by default using the Hierarchy toggle. |
Configure text overflow | Under Text overflow, use the dropdown menu to select one of the following options and apply it to the widget:
|
Display sheet colors | Use the Display sheet colors toggle to choose whether the widget's bar and milestone colors use the manual or conditional formatting colors set in the source sheet. When deactivated, the dashboard’s theme colors automatically apply to bars and milestones. |
Edit the widget title
- In the Timeline Widget panel, expand the Title section.
In the box below the Show title toggle, write a title for your timeline widget.
Change the text format of your title in the Title Styling section.
Set the widget behavior
In the Widget Behavior section, select what should happen when a user selects the timeline widget:
- Take no action: Keeps your timeline widget static
- Open the data source: Leads the user to the source sheet or report
- Open another site: Leads the user to a site relevant to the timeline
- Open a Smartsheet item: Leads the user to a Smartsheet item relevant to the timeline