The plan insights usage dashboard helps you evaluate how your team uses Smartsheet in their daily processes.
The plan usage report offers key metrics and trends on plan information, the licenses and connected users, user growth, asset creation, and any advance capability evaluations.
- To access the dashboard, log into Admin Center, and then select Plan Insights from the left menu.
To share the report, select Download as PDF from the top of the screen.
The plan usage report updates once per day. Currently, the plan usage report is only available for the last 91 days. You can’t adjust the time frame.
See the information below that matches your plan’s model.
If you're unsure about your model type, learn how to determine the model your plan is on.
Plan Usage dashboard: User Subscription Model
The dashboard displays the following metrics:
- Plan information: Displays plan type and renewal date with a link to detailed plan and billing information.
- Expanded user reporting: Displays the threshold for Members (or paid users). Select Buy more to purchase additional paid Members directly from the dashboard.
- Assets and workspaces: Total numbers for each asset and assets created during the reporting period (91 days).
- Advance capability evaluations: If your plan has advance capability evaluations in progress, then metrics are visible; if there are no evaluations, these metrics don’t appear.
Plan Usage dashboard: Legacy Collaborator Model
The dashboard displays the following metrics:
- Plan information: Displays plan type and renewal date with a link to detailed plan and billing information.
- Expanded user reporting: Displays the threshold for licensed users and provides details on connected users. Select Buy more to purchase new licenses directly from the dashboard.
- Assets and workspaces: Total numbers for each asset and assets created during the reporting period (91 days).
- Advance capability evaluations: If your plan has advance capability evaluations in progress, then metrics are visible; if there are no evaluations, these metrics don’t appear.
Advance plans within the Legacy Collaborator Model
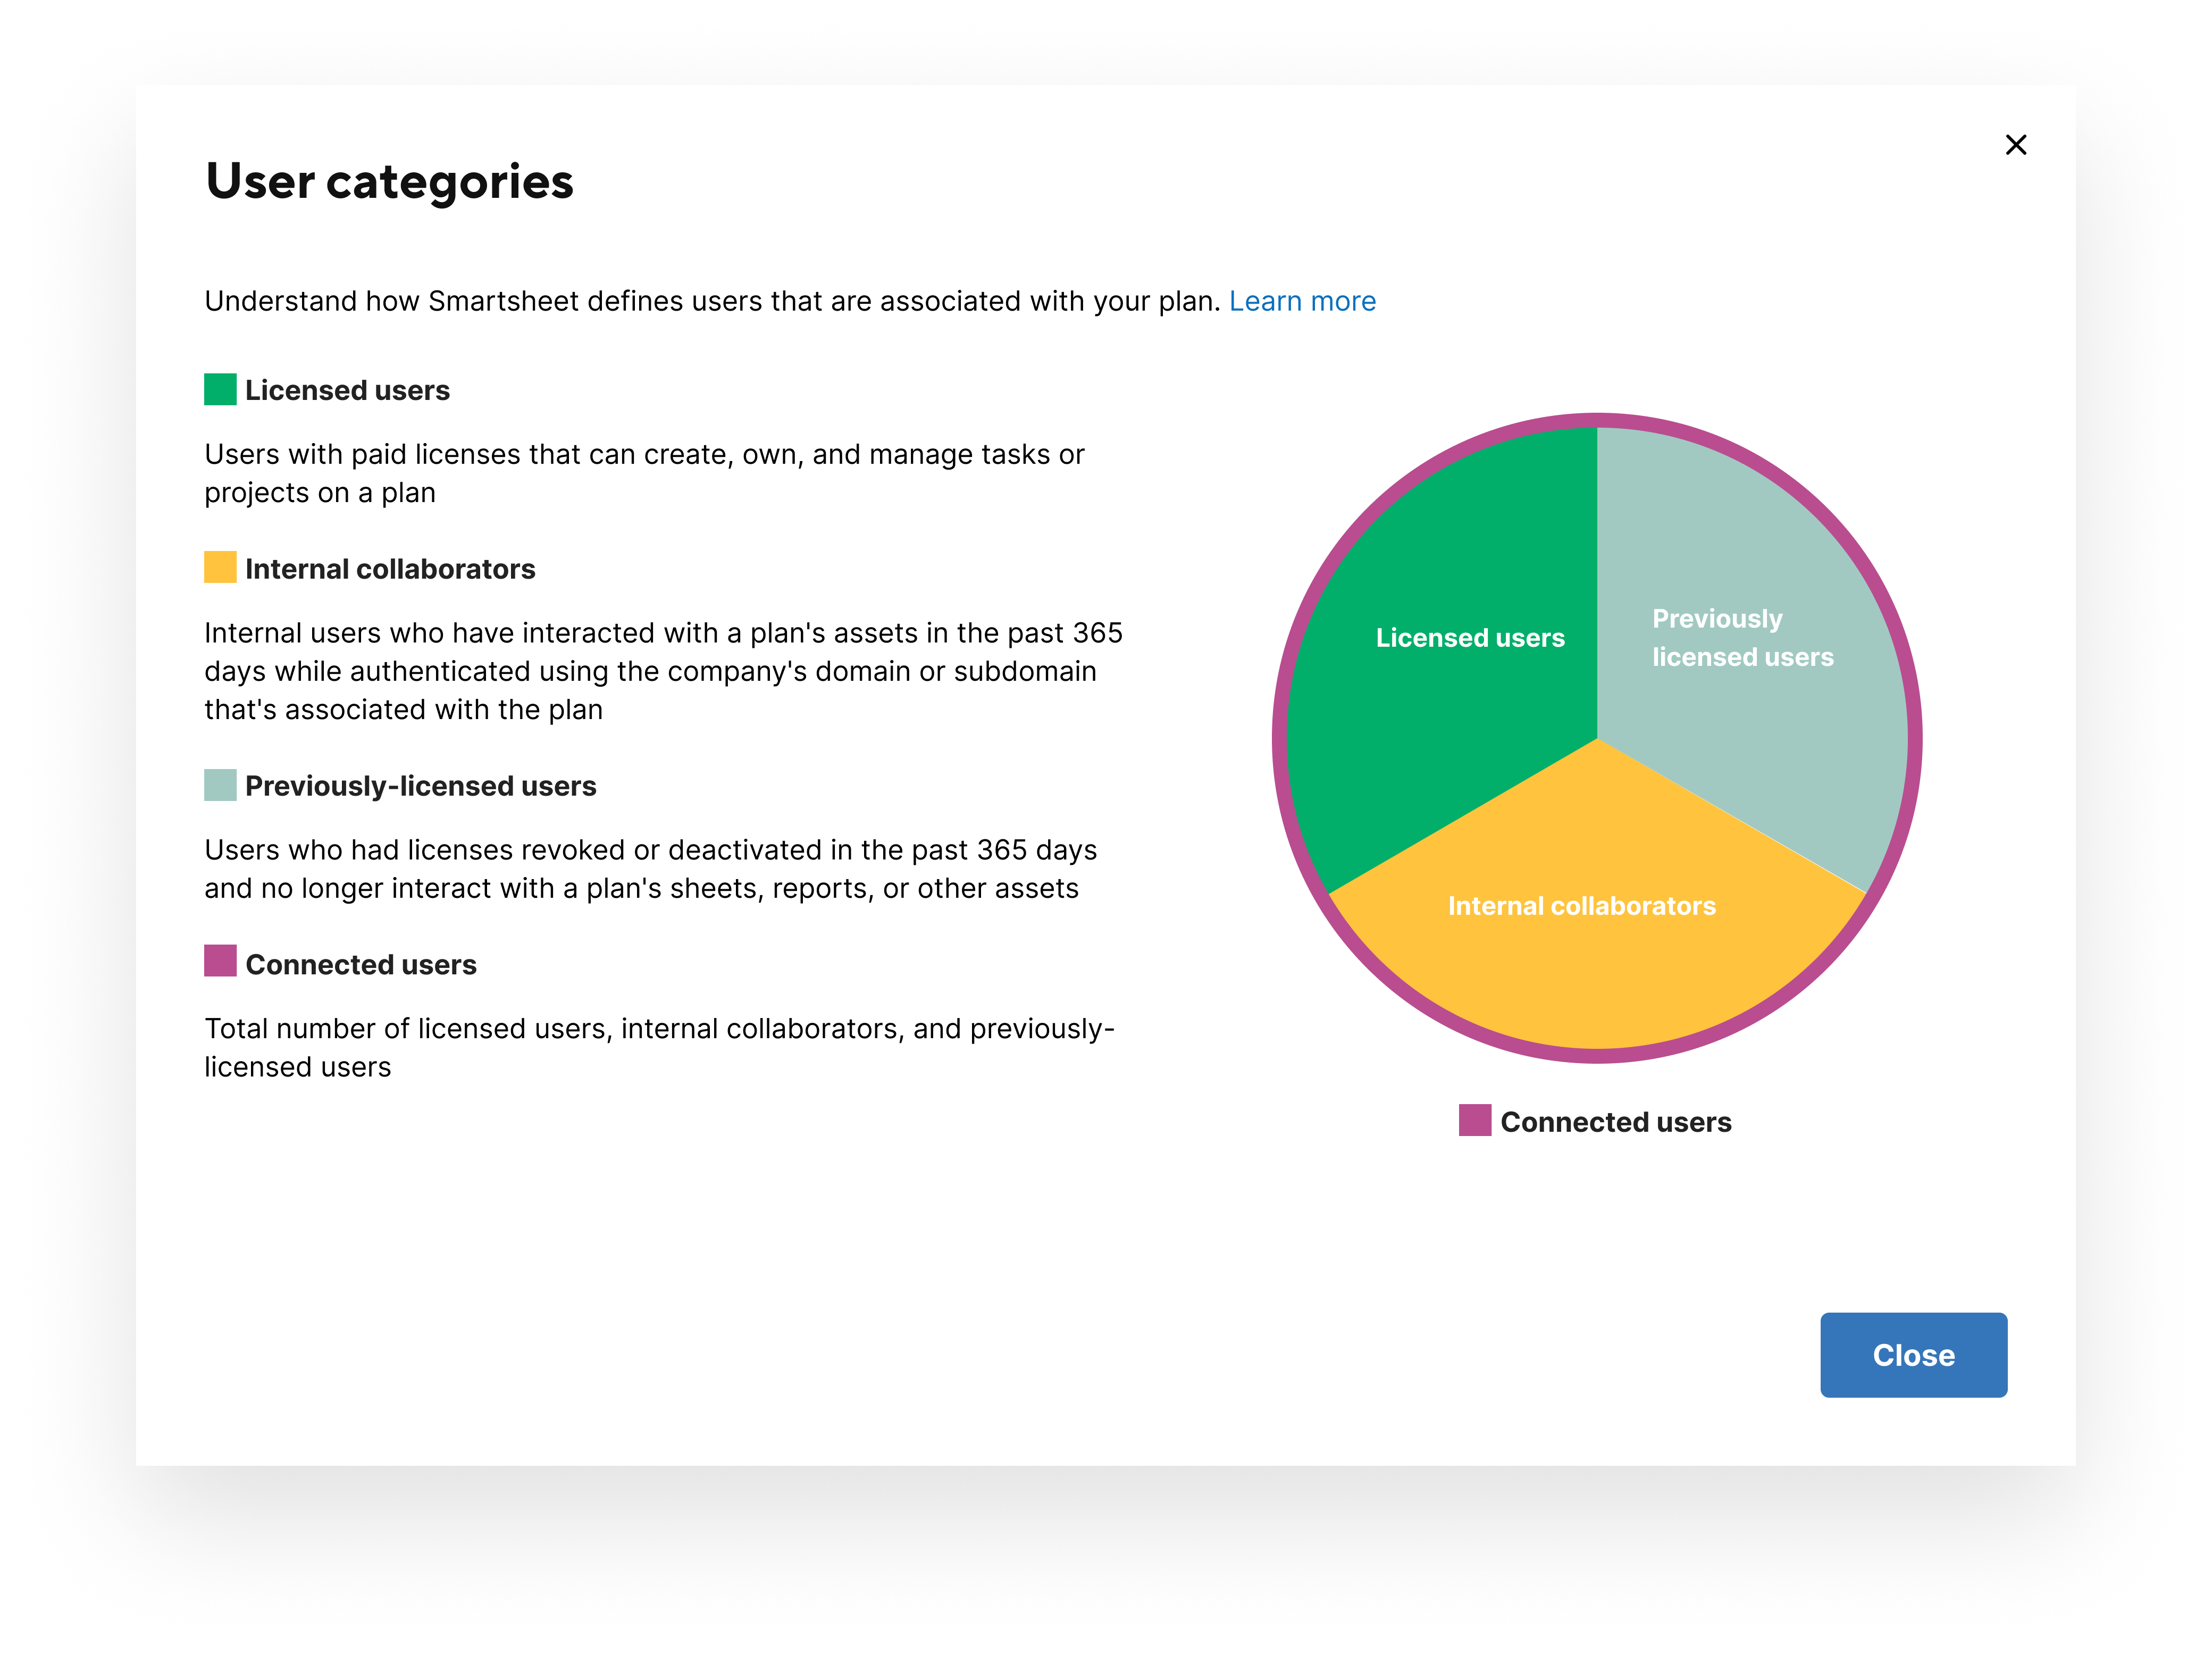
Connected users
Connected users represent the total number of users associated with your Smartsheet usage. This number is relevant when you purchase, true-up, and renew your account.
Connected users are:
- Licensed users: Users with paid licenses who can create, own, and manage tasks or projects on a plan.
- Internal collaborators: Internal users who have interacted with a plan's assets in the past 365 days while authenticated using the company's domain or subdomain associated with the plan. Does not include licensed users.
- Previously licensed users: Users who had licenses revoked or deactivated in the past 365 days and no longer interact with a plan’s sheets, reports, or other assets. Does not include licensed users or internal collaborators.
Gain insight into your users and licensing
Select Create User Report to generate a sheet with more insight into the users that make up your connected user count. This sheet contains information on who a connected user is, their activity, the department they belong to, and the number of assets they have used.
Generating a Connected Users Report
- Navigate to the Admin Center.
- In the Plan Insights tile, select Explore Insights from the Plan usage card.
- Locate the User accounts tile, and then select Create user report.
- A message will appear saying, “This may take a few minutes...”.
Once the report generation is complete, it will not automatically launch or open a new tab. Users will need to manually access their Sheets Directory/Folder to view or access the generated "Connected Users Report" sheet. You may find multiple sheets created with names such as “Connected Users Report 2024-03-13”.
Use the information from plan insights to understand your internal Smartsheet use and growth. Work with your account manager or customer success manager to forecast and budget for your future needs accordingly.
Metrics and definitions
| Metric | Definition | Timeframe |
|---|---|---|
Advanced Capability Plan Insights
Plan insights show data and usage metrics for Data Shuttle and Dynamic View. The usage reports update once per day.
You must have a Data Shuttle or Dynamic View subscription or an evaluation of one of those capabilities or an Advanced Work Management subscription. If you're in an evaluation, your report timeline is scoped for the evaluation duration. Learn more about advance capability evaluations.
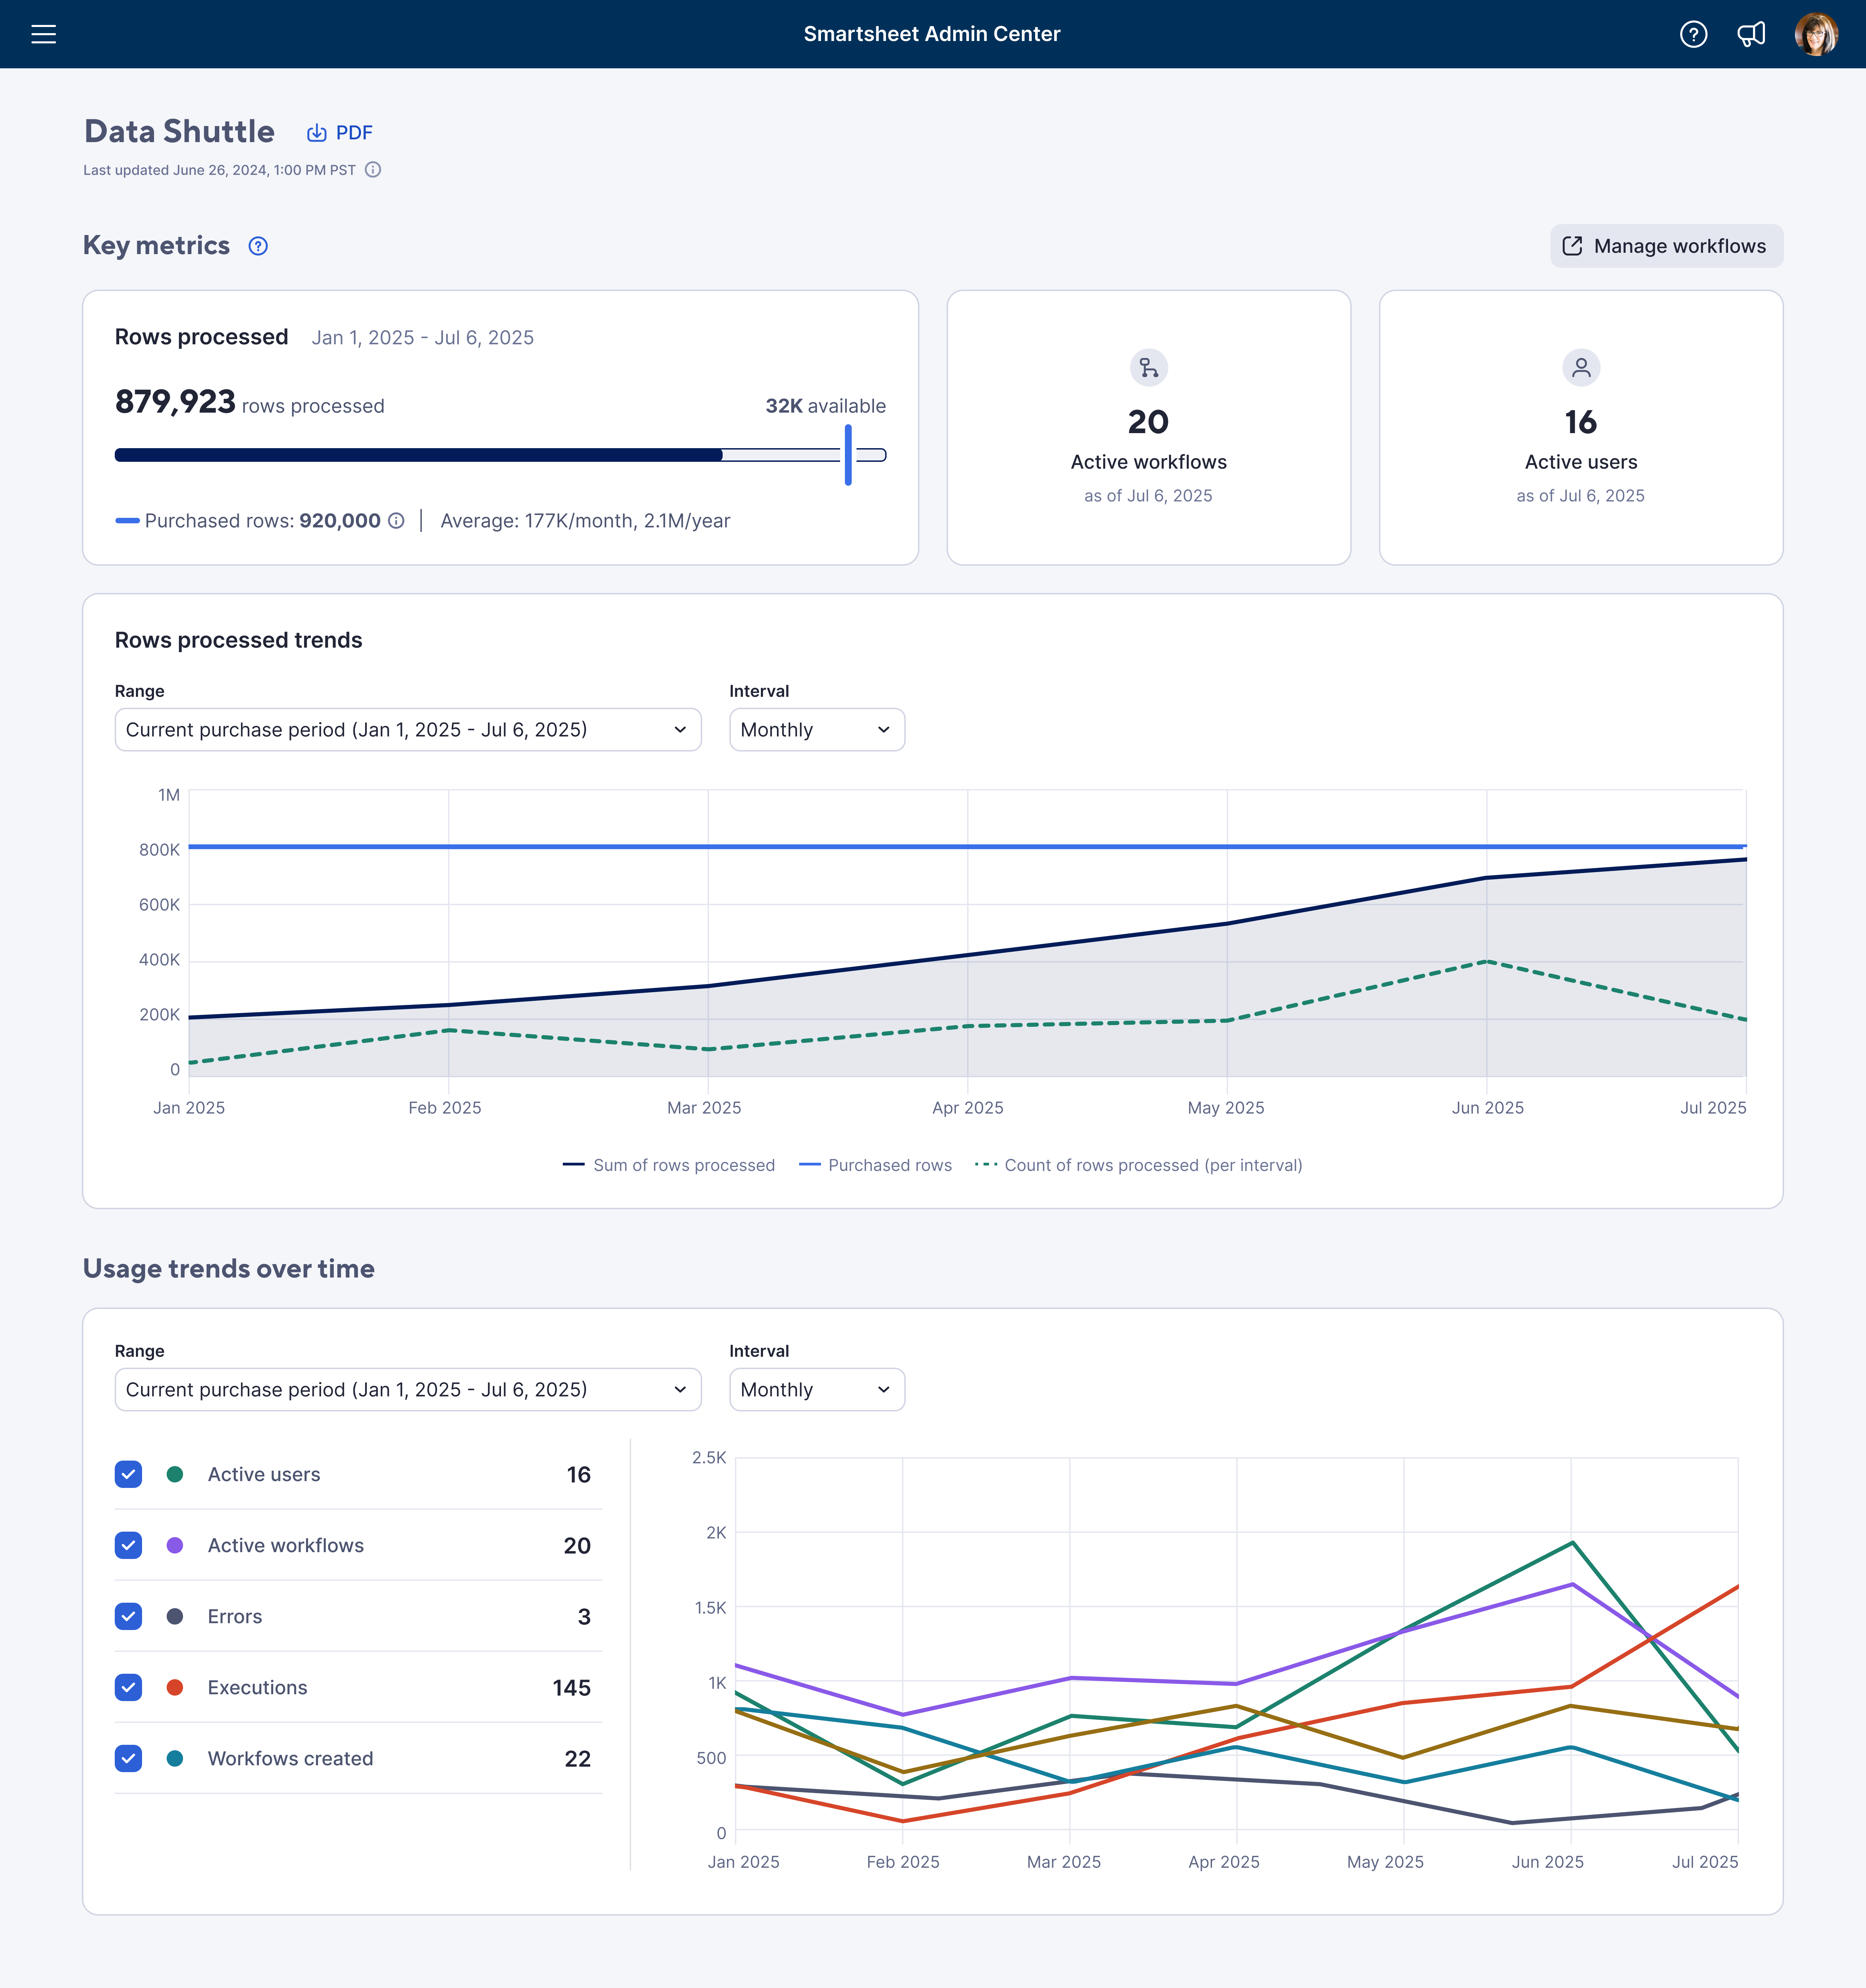
Data Shuttle
You can see insights data that include the total number of workflows created, rows processed, executions, active users, and errors. The data displayed calculates at the plan level from the previous 90 days.
| Metric | Definition |
|---|---|
| Metric Rows processed | Definition The sum of the number of rows:
|
| Metric Active workflows | Definition Total number of workflows created and not deleted/archived |
| Metric Active users | Definition Total number of users with at least one executed Data Shuttle workflow |
| Metric Workflows created | Definition Total number of workflows created in the plan |
| Metric Executions | Definition Total number of workflows executed (ran) during the reporting period aggregated at the plan level |
| Metric Errors | Definition Total number of workflows that have errors |
Dynamic View
You can see insights data that include the total number of views created, rows updated, executions, active users, errors, and more. The data displayed calculates at the plan level from the previous 90 days.
| Metric | Definition |
|---|---|
| Metric Views created | Definition Total number of Dynamic Views created during the reporting period |
| Metric Rows updated | Definition Total number of rows updated in all Dynamic Views |
| Metric Shared views | Definition Total number of Dynamic views that are shared to collaborators in the plan |
| Metric Active views | Definition Total count of Dynamic Views that are not deleted |
| Metric Shared collaborators | Definition Total number of collaborators who are shared to Dynamic Views |
| Metric Active users | Definition Count of all unique users who have accessed/viewed a specific Dynamic View or created a Dynamic View |
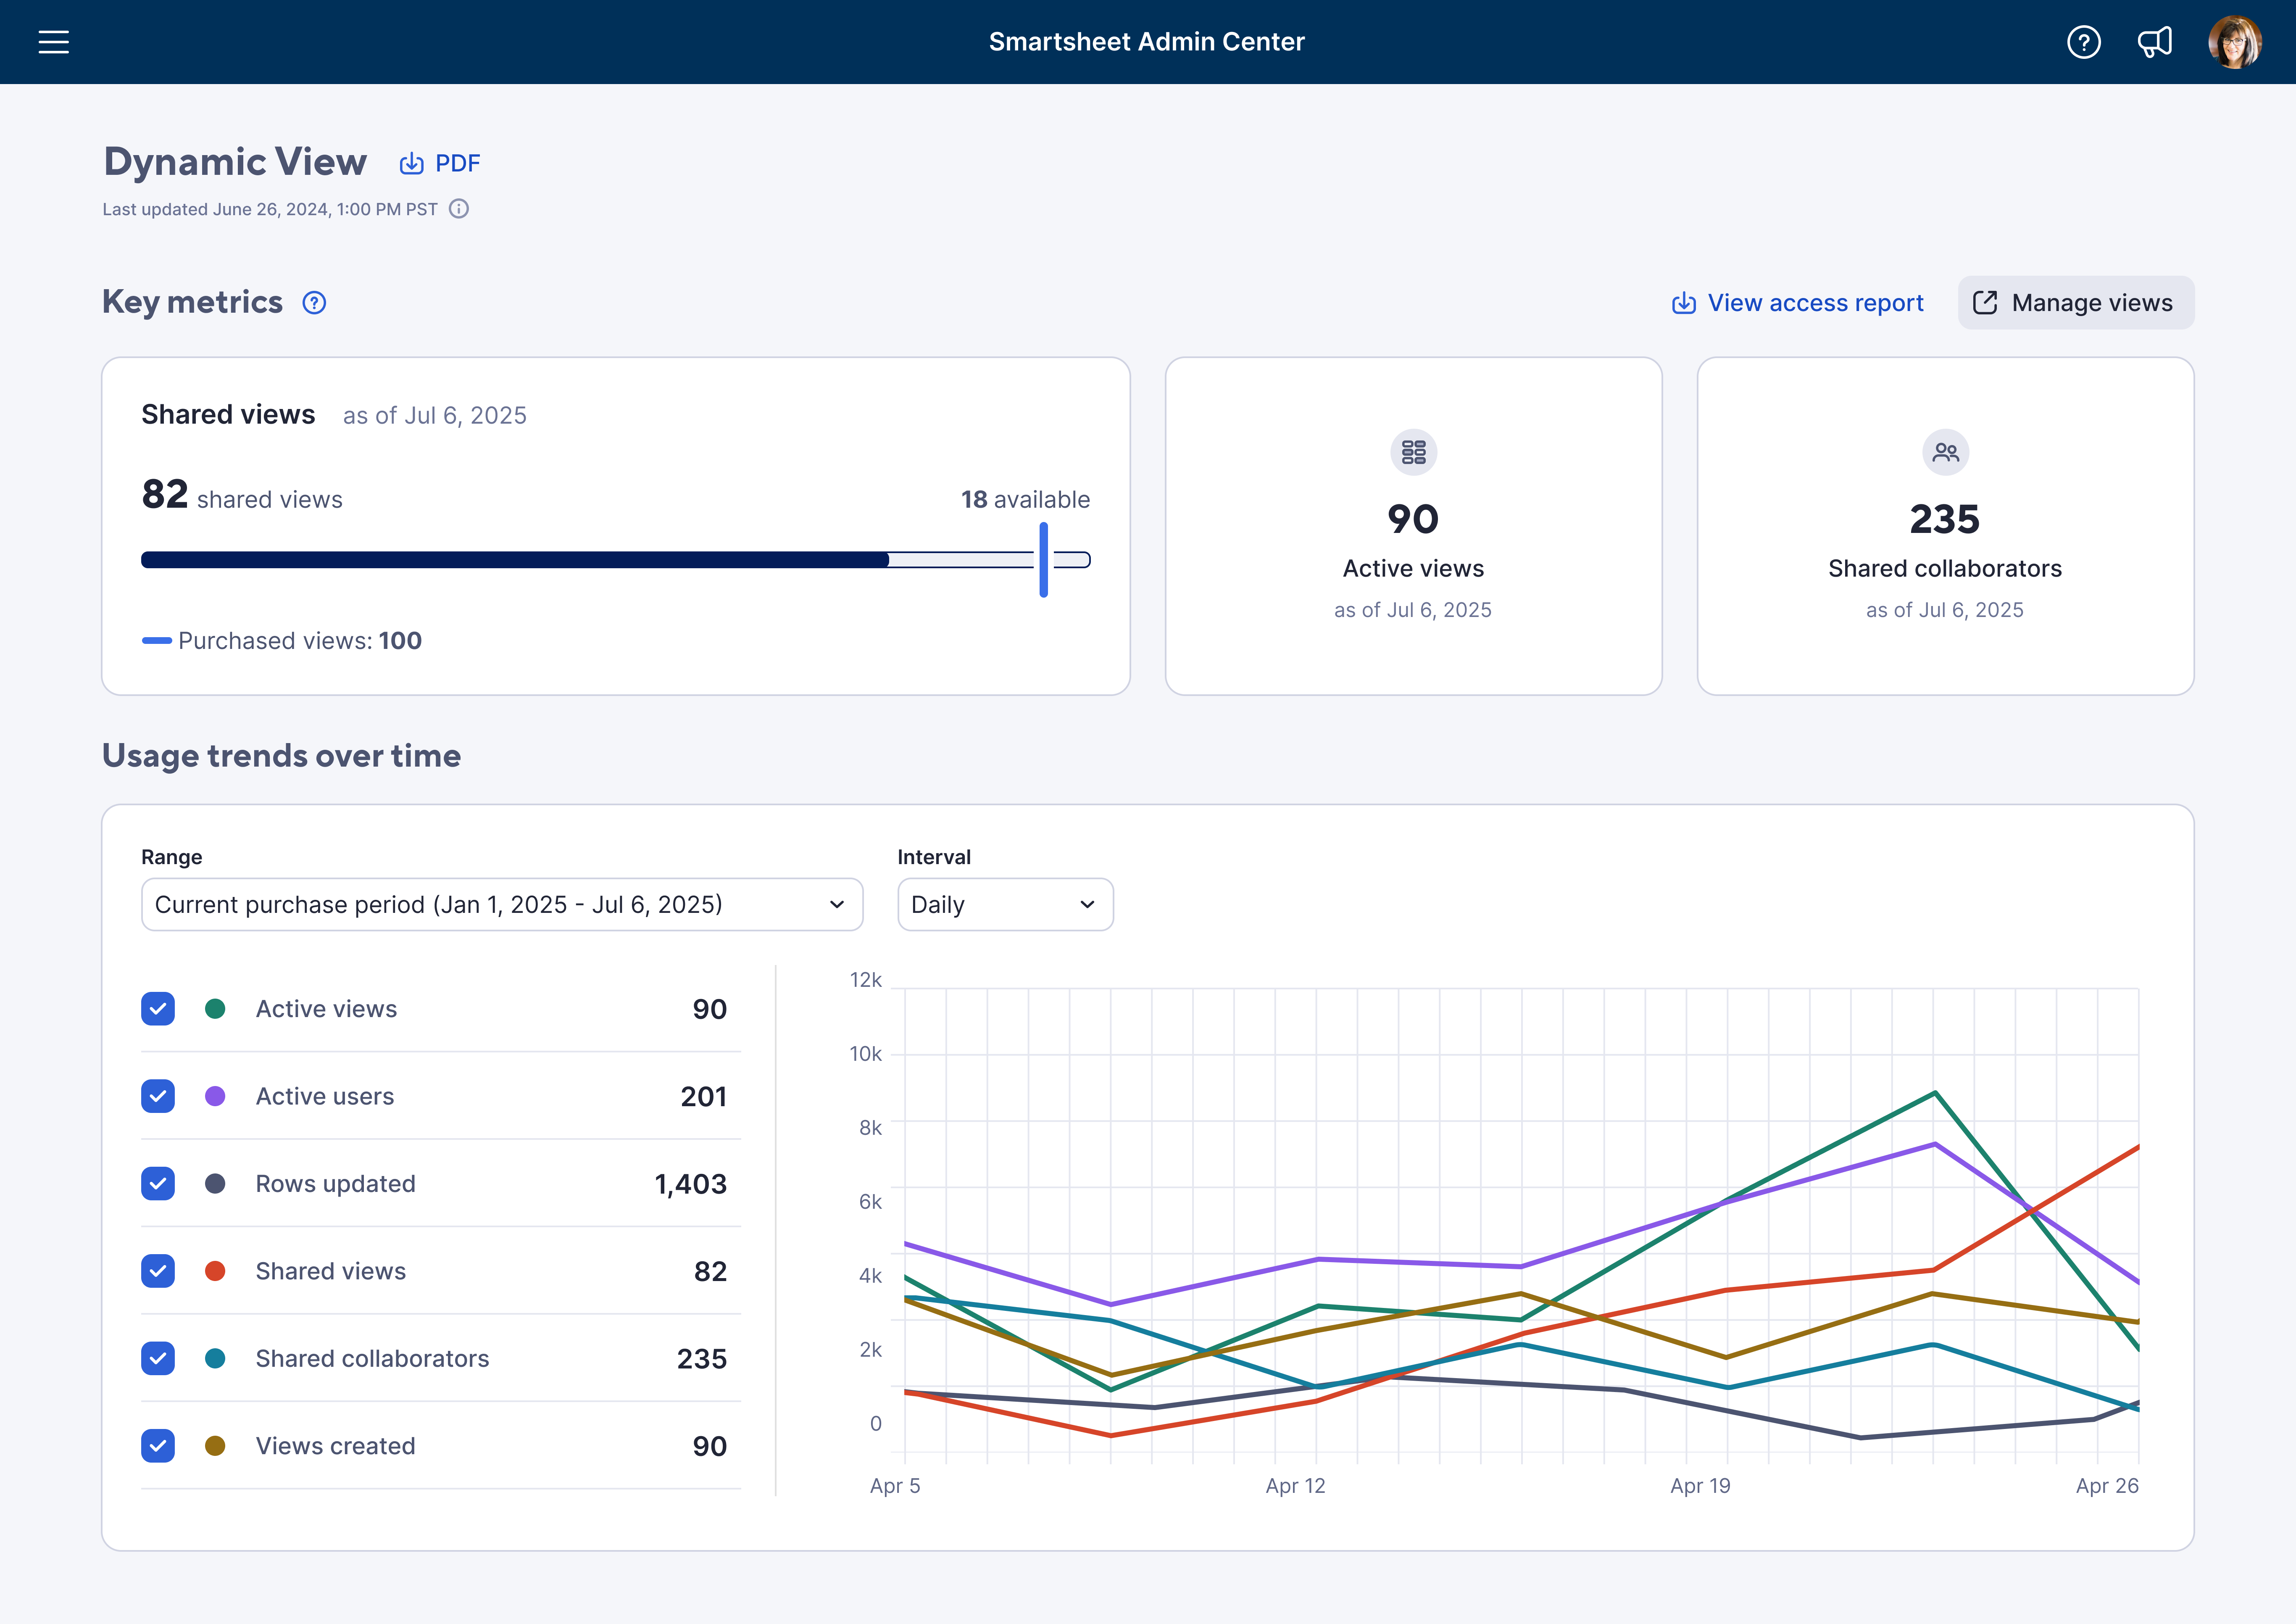
You can download a Dynamic View access report at any time by selecting View access report.
Why do I see different numbers of Licensed users on the Admin Center home page and the Plan Insights page?
The Plan Insights page doesn't show changes right away. Data is updated once a day.
The licensed user count in Plan Insights doesn’t include pending users – those who haven’t accepted their licenses. The number on the Admin Center home page includes pending users.
Pending users are not included in the Connected User Report Licensed User column.
Why are users with no last activity counted as connected users?
Connected users is the total number of licensed users, internal collaborators, and previously-licensed users. If a user is a licensed user or a previously-licensed user, the user will still be counted as a connected user even if there is no activity.
Why does a user have a login record on the Access Report in 2022 but the Connected User Report shows the user’s last activity is in 2021?
Last activity counts any user interaction including view, click, submit a form (while logged in), comment, respond to an update request, and more.
Logging in without interacting does not count as user activity.
In the Connected Users Report, what is the difference between Items Edited and Items Viewed?
When the user edits a sheet, report or dashboard, it counts as an item edited. If a user opens an item but does not change anything, it counts as and item viewed.
Items edited does not include items viewed.