Summarize and dynamically refresh data that you’ve stored in a sheet.
Smartsheet Pivot App is a premium add-on and is available for purchase. Contact Smartsheet Sales for more details.
Use the Pivot App to create a pivot table that allows you to:
- Create rollup summaries to surface key information across multiple sheets
- Keep summary metrics up to date as you add new data
- Quickly identify and adapt key segments as your data needs change
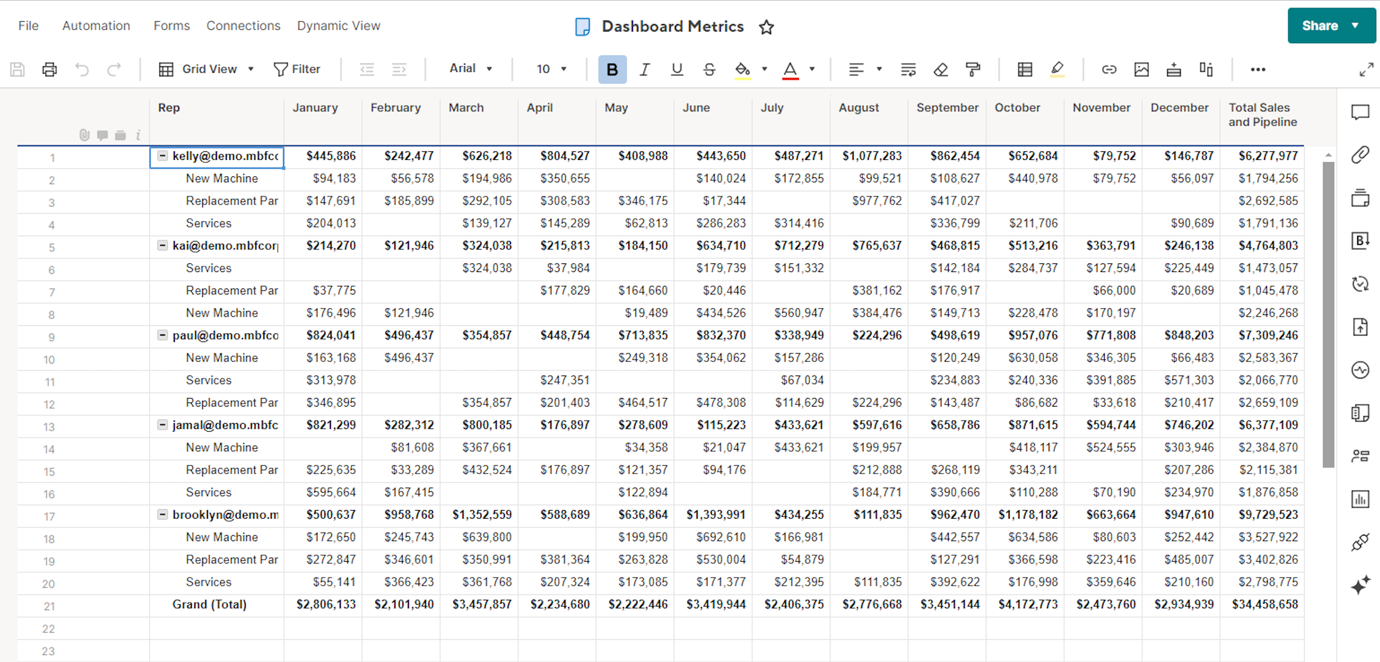
For example, with Pivot App, you can take data that looks like this
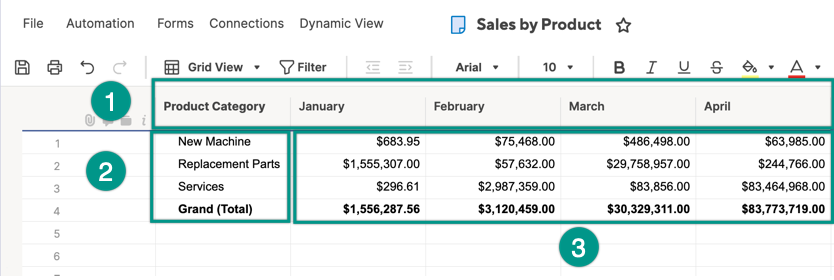
and make it look like this:
Keep the following in mind to use Pivot App
- You must be a Smartsheet user on a plan that includes the Pivot App.
- You first must have your source data on a sheet or report to create a pivot table in the Pivot App.
- You should have Owner or Admin-level sharing permissions for the source items.
Sign in to the Pivot App
- On the left navigation bar, select Launcher.
- Select Pivot.
Create a pivot sheet
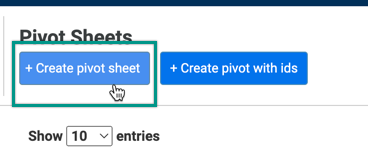
Select +Create pivot sheet in the upper-left corner of the Pivot App and then follow the steps in the wizard.
Step 1: Select sheet
- Search or browse to find the source sheet or report containing the data you want to summarize.
- Select the desired sheet or report and select Next.
Once you commit to a source sheet for the pivot sheet, you can’t change it. Start a new pivot sheet to use a different source sheet or report.
Consider using a report as the source of your pivot to add or remove criteria or create a pivot from multiple sheets.
Step 2: Assign columns
In the Assign Columns step, you choose the rows, columns, and values you want in your pivot sheet. You can also name your table and indicate how often it should refresh.
- Select Add Field above the Columns, Rows, and Values boxes to select the source for those items in the pivot sheet.
- In the Pivot name box, type a name for the pivot sheet.
- In Execution Frequency, select how often you want the table to update. Select an option for your pivot table to update periodically and reflect changes in the source data.
Guide for column, row, and value placement
Use the following image to help you decide how to position the data in your pivot table.
- Columns: These fields are the values across the top of your pivot table (calendar months, for example).
- Rows: These fields appear on the left side of the pivot table. If you add multiple fields, you create hierarchies. The hierarchy is driven by the order in which the fields appear in the Rows box.
- Values: These fields appear at the intersection between the rows and columns of the pivot table and can be sums, averages, or counts.

Step 3: Destination
In this step, you specify a name for the new pivot sheet and specify a destination for it in Smartsheet.
- In the Sheet name box, type the name for the destination sheet.
- Under Select destination folder or workspace, select where you’d like to save the new pivot table.
- Select Next > Create to set up the instructions in the Pivot App.
If you’ve set an Execution Frequency (how often the pivot updates), the system builds the pivot table at the next scheduled run time. To preview and create the pivot table right away, build it and create a sheet for it in Smartsheet.


