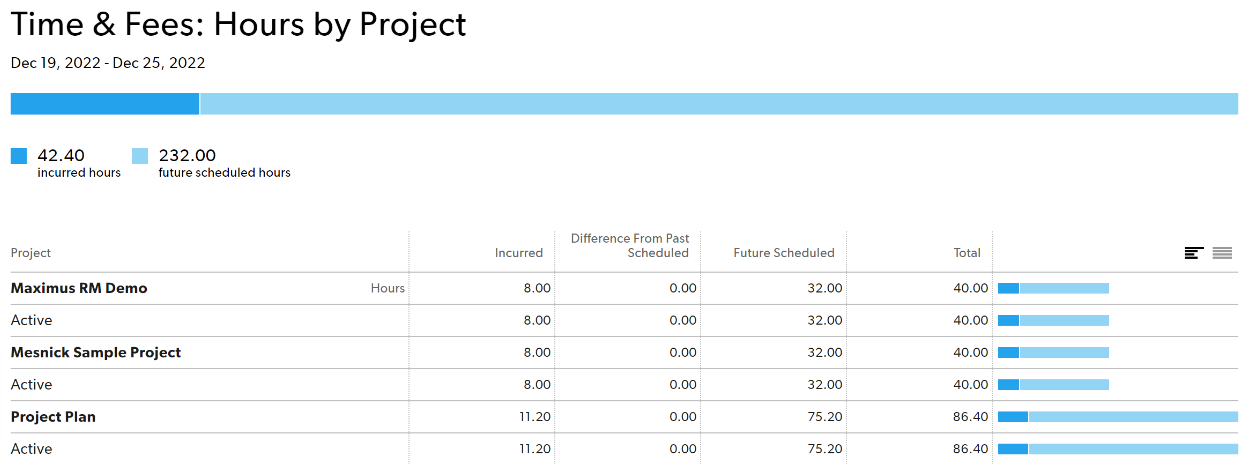
Time and fees reports show project progress and compares your actual time and fees to scheduled time and fees.
USM Content
Time and fees reports pull data from your selected metrics: hours, days, amounts, amounts & hours, or amounts & days.
Create a time and fees report
- In the top navigation, select Reports.
- Select the New Report button.
- On the left sidebar, under View, select Time & fees and the appropriate option (Hours, Days, etc.).
Select Time Frame and the appropriate option (This Year, Last Week, etc.).
If you select a time frame relative to today, the report is dynamic and continues to show data with respect to the current date. If you want a set time range, select Custom Date Range.
- Set your First group by and Second group by options if needed.
- Set any necessary filters.
- Select the Run Report button.
The projects visible vary by permission level. For example, Project Editors can only see projects they own.
Time and fees report columns
| Column | Description |
|---|---|
Selected Groupings | Select a row to see individual time entries under each group. |
Bill Rates | If you chose amounts when you set up your report, you can see the Bill Rate column. This column shows a person’s applied bill rate for the hours worked on a project. Sometimes reports show groups where multiple bill rates are included – for example, when grouping by discipline. |
Incurred | The actual amount already incurred on the project. Your account setting, Incurred Hours And Amounts, determines if this includes both confirmed and unconfirmed hours by default, but you can also modify it in the report's Entry Type or Approval Type filters. Future time doesn't appear as incurred time on reports. |
Difference from past scheduled | Shows the difference between incurred time or money and the original plan. For example, if a person was originally scheduled to work on a project for four hours on a given day, but they confirmed five hours, the difference from past scheduled column shows +1. |
Future scheduled | Time or money scheduled in the future. |
Remaining | The amount of time or money still available for the project. |
Chart | The chart allows you to compare the incurred, difference, and future scheduled against each other. |
When you export a summary report CSV, the column order may change, and any applied filters appear in the CSV.
Example uses for time and fees reports
Create a revenue forecast by time and budget
- View: Time & fees: Amounts & hours
- Time frame: Next 30 days
- First group by: Client
- Then group by: Project
- Show: Everything
Create an unconfirmed hours report
Unconfirmed time reports are useful if your organization tracks time. This report shows who hasn't entered or confirmed their time during the given time period.
Here are the settings for an unconfirmed time entries report.
- View: Time & fees: Hours
- Time frame: Last week
- First group by: Entry type
- Then group by: Team member
- Show: Entry type: Unconfirmed
Create an hours summary by department report
- View: Time & fees: Hours
- Time frame: Last month
- First group by: Discipline
- Then group by: Team member
- Show: Everything
Create a report for incomplete timesheets
To see a report for people who have not updated their timesheets, review unconfirmed time for the week. To see who has updated their time sheets, review confirmed hours.
- View: time and fees (hours)
- Time frame: this week (or whatever duration is desired)
- First group by: team member
- Then group by: project
- Show: time entry type: unconfirmed
If you have the Advanced reports feature, you can utilize the missing timesheets Smartsheet report to analyze and communicate this information.
Create a leave report
The leave report shows you all leave incurred (already taken), the difference (unplanned and taken leave), and future scheduled (planned on the schedule for the future) for the time period you selected.
- View: time and fees (Hours or Days)
- Time frame: this week (or whatever duration is desired)
- First group by: Leave Type
- Then group by: Team Member
- Show: Leave Type (select any you want to see in the report)
Create a scheduled hours report
In a scheduled hours report, you can see the hours each person was scheduled for the specific project.
- View: time and fees (Hours)
- Time frame: this week (or whatever duration is desired)
- First group by: Team Member
- Show: Project (Select the specific projects you want to see)
Advanced reports
If your organization has a Business or Enterprise Smartsheet plan and uses Smartsheet authentication, then you can further analyze and share the data from your time and fees report in Smartsheet. When you create an advanced report from a time and fees report, multiple Smartsheet assets are created for you, including:
- Source sheet
- Time and fees report
- Missing Timesheets report
- Dashboard
The missing timesheet report displays the list of team members who haven’t submitted any time for a given week for the past 90 days. This report determines submission status using a calculated submission status column in the underlying data sheet. That column’s formula returns the following values:
- Not Entered: The resource didn’t enter any time for the week
- Rejected: The resource has one or more rejected entries for the week
- Submitted: The resource has at least one pending or approved entry for the week
- Unsubmitted: The resource confirmed at least one entry for the week, but never submitted for approval
You can modify the submission status column formula if your organization has different rules for missing timesheets (i.e. a resource must submit time for each workday to avoid counting their timesheet as missing).
Learn more about the advanced report and the associated Smartsheet assets.