Use the sheet summary pane to define, organize, and report information related to your work.
You can use sheet summary to move critical metrics and summarize data from the sheet, allowing filtering and sorting in one place for easy access.
Take advantage of sheet summary to display overall project metrics, tag sheets with custom metadata for better search, and more.
Access the sheet summary pane
- Select the Summary icon
Brandfolder Image
 from the right feature bar of your sheet.
Create new sheet summary fields
The sheet Owner and Admin can add new sheet summary fields, edit field properties, and type in existing locked or unlocked fields.
- Select the New Field button at the bottom of the sheet summary.
- Choose the field type for the information you want to display.
- Type a name for your field and select OK. A new, blank field will appear on the sheet summary.
You can also make other changes, such as adding new fields, editing properties, or adding a formula to a field.
- Save changes on your sheet after making sheet summary changes.
You can edit your sheet summary fields at any time. Open the pane and select the More
Brandfolder Image
![]() icon to the right of the field you want to change.
icon to the right of the field you want to change.
For seamless work, you can use the open pane to see the sheet and the summary simultaneously.
Use the More icon to customize your fields by adding hyperlinks, images, and more.
Summary field types
| Field type | Description |
|---|---|
| Field type Text/Number | Description Text descriptions, numbers. For example, project summary and overall budget. |
| Field type Contact List | Description Display someone from your available contacts. For example, the project manager or a point of contact. |
| Field type Date | Description An important date. For example, the start or finish date of a project. |
| Field type Dropdown List | Description Choose a dropdown option from a custom list. For example, department name, project type, and project status. |
| Field type Checkbox | Description A checkbox that can be checked or unchecked. |
| Field type Symbols* | Description Collections of visual icons. For example, Harvey balls, stars, and signal bars. |
*With boolean symbols (flag, star, and checkbox) write the formula in a text field, then change the field property to the symbol you want to use.
Sheet summary limits
The sheet summary supports:
- Up to 200 fields (does not count against sheet columns)
- Field Names up to 50 characters
- Field values equal to cell sizes
- Up to 500 dropdown options
Best practices
Depict key project details using formulas or symbol columns
Embed formulas in sheet summary fields to see critical metrics whenever you open the sheet summary pane.
See Calculate key project metrics with sheet summary formulas for more information.
Make search easier by categorizing sheets
Create sheet summary fields that contain key values that can be easily searched. For example:
- Label the department using a Dropdown List or Text/Number field.
- Add keywords to a Text/Number field. For example, construction, electrical, or engineering.
See, Use search to find Smartsheet items for more information.
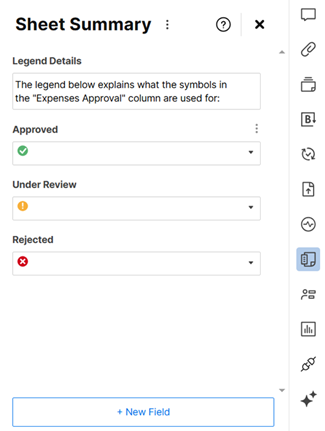
Create a legend to explain how symbols are used
Build a legend in the sheet summary to describe the meaning of each icon or symbol on your sheet.
To create a legend:
- Add a Text/Number field at the top of your sheet summary with a description of the legend.
- Add Symbol fields to the sheet summary, one for each symbol. In the name of the field, type the purpose of the symbol. Make sure to select the group of symbols being used on the sheet for each field.
- In each Symbol field, set the icon that matches your description.