Smartsheet reports allow you to easily work with real-time data from across multiple sheets in a single view. You can consolidate key tasks and milestones into an overview for stakeholders, or create different views for various initiatives.
Reports are bi-directional, so information updated on a report automatically updates back to the underlying sheets and vice versa. You can build a row report from rows and columns on a sheet, or a sheet summary report from the sheet summary fields.
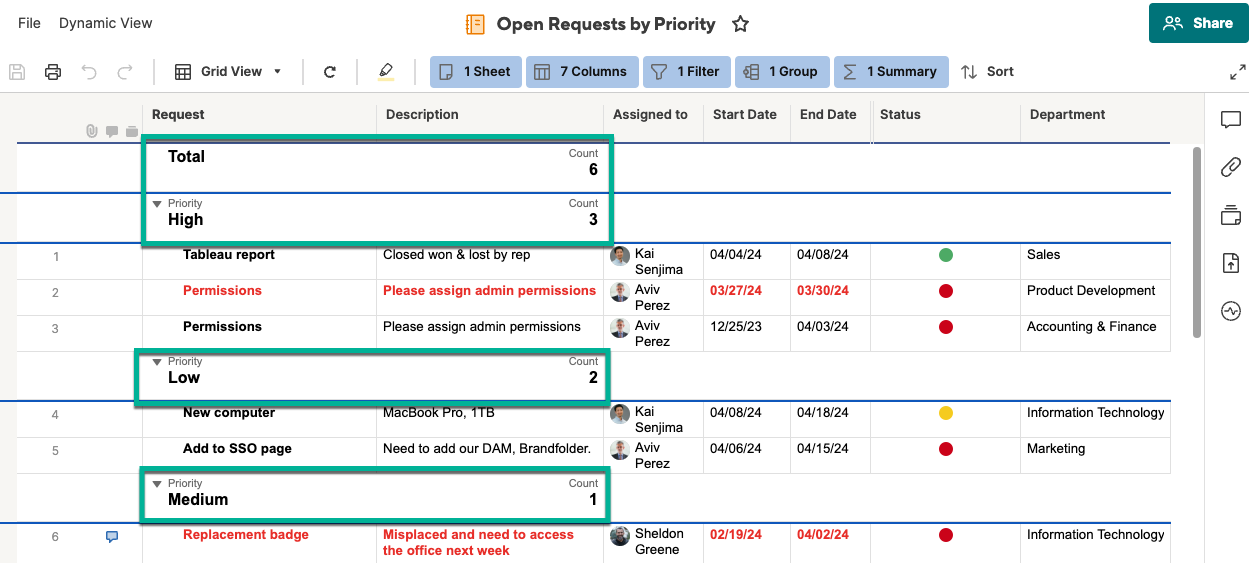
Grouping and summary in reports provides quick and easy aggregation and calculation across data from multiple sheets.
Reports can easily be shared to anyone who is also shared to the underlying sheets populating the report. For more granular control, you can publish your report, or display it in a dashboard, ensuring that your audience only sees the high-level information you want to display without requiring they be shared to the underlying data.
Report Types
Reports are bidirectional, this means that the information updated on a report automatically updates back to the underlying sheets and vice versa.
Similar to a sheet, you can send, share, and publish a report. You can also edit, group, summarize, and sort the data in the report.
- You can share reports with anyone who is also shared to the underlying sheets populating the report.
- If you don’t want to share the underlying sheets with your audience, publish your report, or display it in a dashboard. This way you ensure that your audience only sees the high-level information you want to display.
Note that, because it doesn’t store any information, reports only display information stored in sheets. That’s why reports don’t count against the sheet limit for your account.
There’s a limit to the number of sheets that can be the source of your report: 30 000.
There are two types of reports available: row reports and sheet summary reports.
Row Reports
With Row Reports, you can aggregate row information from multiple sheets. For example, you can create a report to see all your high-priority incomplete tasks, pulled from multiple sheets.
See Build a Row Report with Report Builder to learn more.
Sheet Summary Reports
With Sheet Summary Reports, you can display summary data from multiple sheets. Sheet summary reports are a great way to get a high-level overview of multiple projects or to highlight portfolio-level metrics in a dashboard.
These reports aggregate sheet summary fields from one or more sheets into a single report to surface key metrics based on report criteria.
See Create a Portfolio View With a Sheet Summary Report for more on building a sheet summary report.
Build a row report
You can add rows from multiple sheets into one report with a row report. If you need to add multiple sheet summaries into one report create a sheet summary report.
Create a Row report
- Select the Browse tab, then select Workspaces.
- Find the workspace you want the report to live in. Select workspace name to open it.
- Select Create.
- Select Report.
Then select the Row Report option.
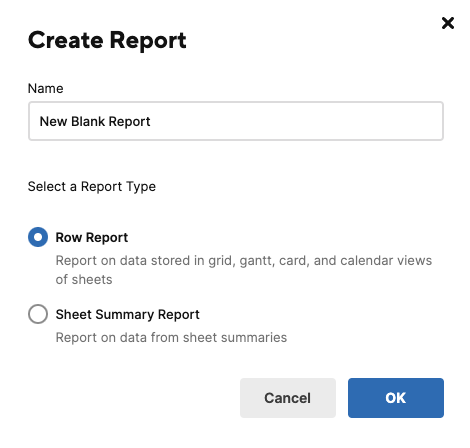
Configure the report
If you are working with large amounts of data, consider applying additional summary filters to the report when you configure it. Sheet name, Created (date), and Modified (date) can limit the data included and help your reports run more efficiently.
Source Sheets
Source sheets are the sheets you want to pull in data from for the row report. You can have up to 30,000 source sheets for the report. You cannot use reports as source sheets for other reports.
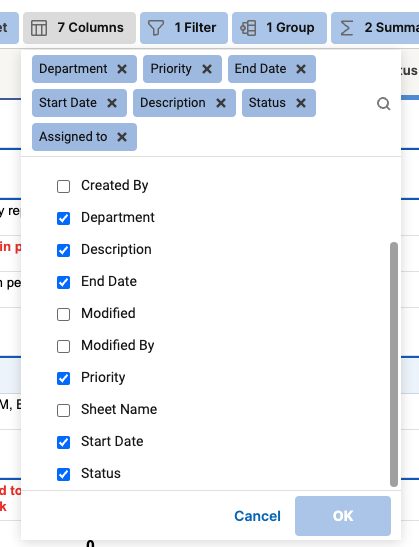
Columns displayed
In the columns displayed dropdown, select the columns from your source sheets that you want to add to your report. You can have up to 400 columns selected.
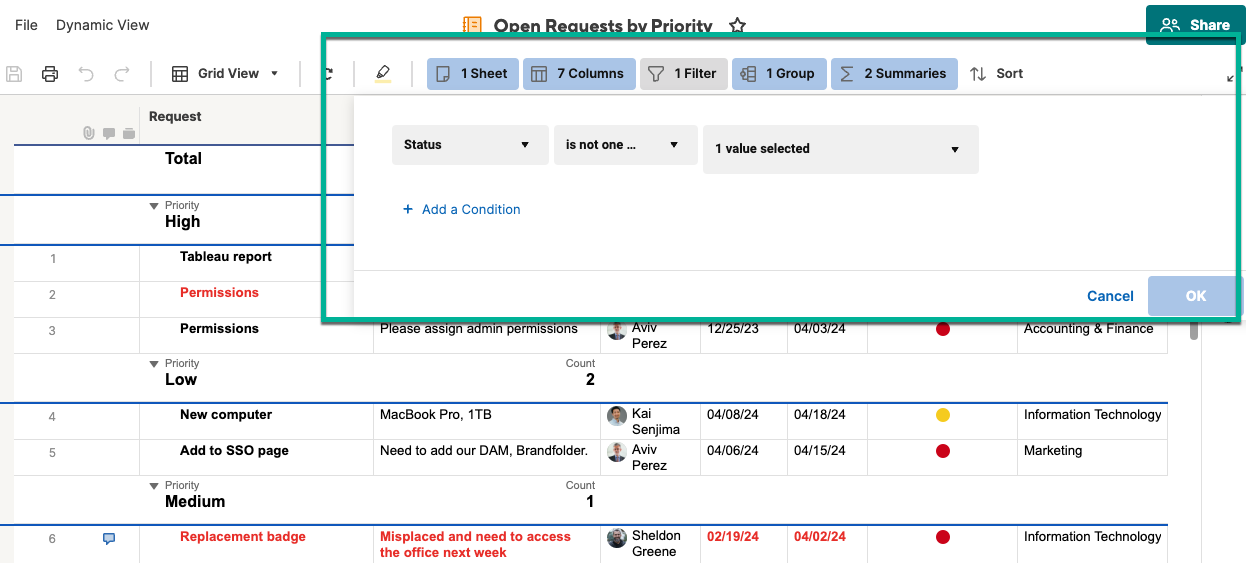
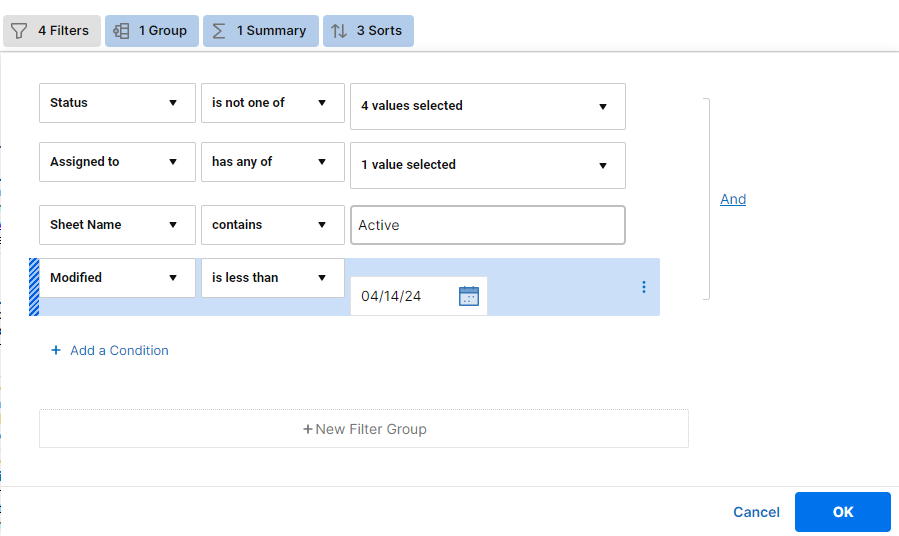
Filter criteria
Set filter criteria to filter the data that gets pulled into your report from the source sheets. Only the data that meets your filtering criteria will be displayed in the report.
Group
Organize your data into groups which help you easily access the information you need.
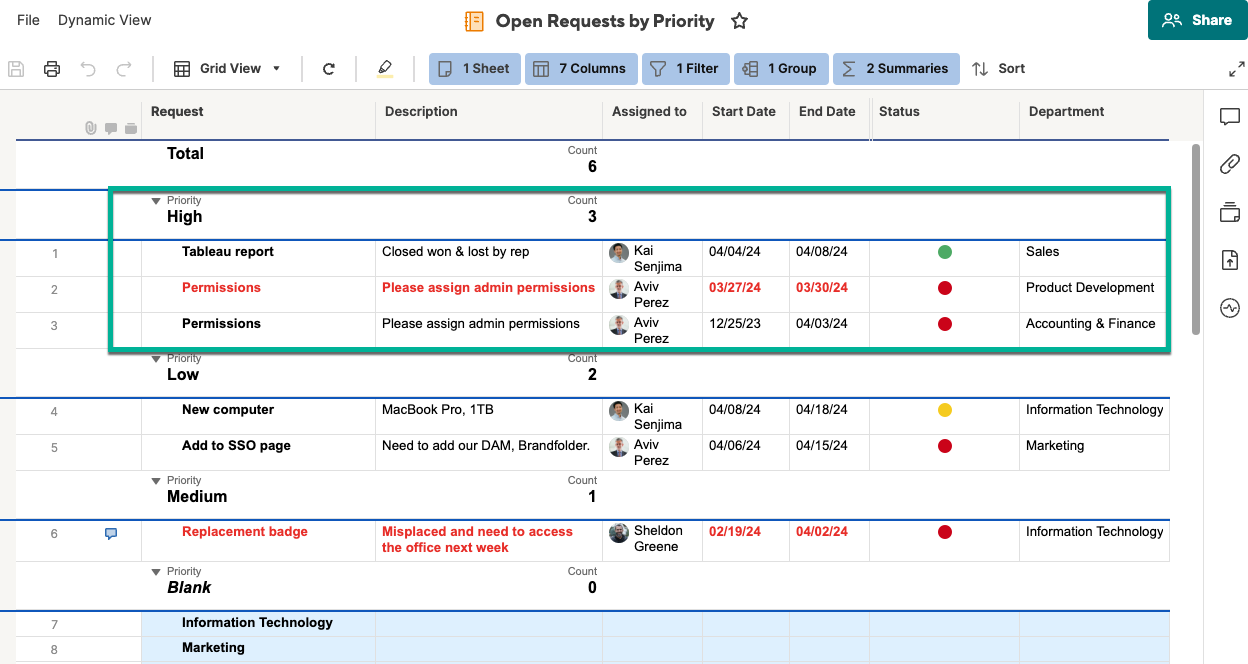
Summarize
Summarize your data by defining key metrics to help you make informed decisions. Summary data is always displayed in the grouping row and cannot be formatted differently.
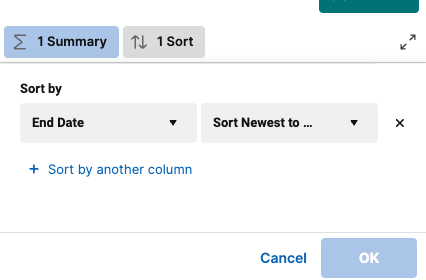
Sort
Sort the data in each group in a particular order: Oldest to Newest or Newest to Oldest.
Work with source sheets in reports
On a new report, the source sheets selection window is open by default. If you're editing a report, select the Sheet tab from the navigation bar.
Sheets that you've created or that have been shared with you, are available from this list. You can find sheets by scrolling or by typing into the source sheets search bar.
You must select at least one sheet, folder, or workspace from the Sheet tab before the other options (Columns to Display, Filter Criteria, Group, Summarize, Sort) become available in the report builder.
There’s a limit to the number of sheets that can be the source of your report: 30 000.
Consider using the Modified and Sheet Name filters in your report, these help to keep the scope as small as possible, which could greatly improve the loading of the report.
Keep the following in mind
If you select a folder, new sheets added to that folder after you've selected it won't be included in your report. To include newly added sheets, remove the folder from the Sheet tab and then add it back.
Use a workspace if you want your report to always include new sheets.
- Formatting (cell, font color, background color, bold text, and so on) in a report is based on the formatting in the source sheet.
- Reports don’t display row hierarchies from the source sheet.
- You can’t modify cells containing formulas from a report. You must modify them in the source sheet.
- Pulling numerous data into a report can increase load times. Add filters to your report to reduce the data and decrease load times. .
Work with start and end dates in reports
You can't edit end dates for rows in underlying sheets in the report because they're automatically calculated based on the dependency settings. Edit the start date and duration in the source sheet to automatically recalculate the end date.
You can't edit the start date of a task driven by a predecessor from a report. Instead, change the start date or duration of the predecessor task to automatically recalculate the dates associated with dependent tasks.