Learn more about the different types of reports available in Resource Management including:
- Time and fees reports
- Expense reports
- Budget reports
- Utilization reports
- Leave reports
- Scheduled hours reports
Create time and fees reports
Time and fees reports pull data from your selected metrics: hours, days, amounts, amounts & hours, or amounts & days.
View a time and fees report:
- Select Analytics, then select New Report.
- On the right sidebar, click View, select Time & Fees, and then select a time frame.
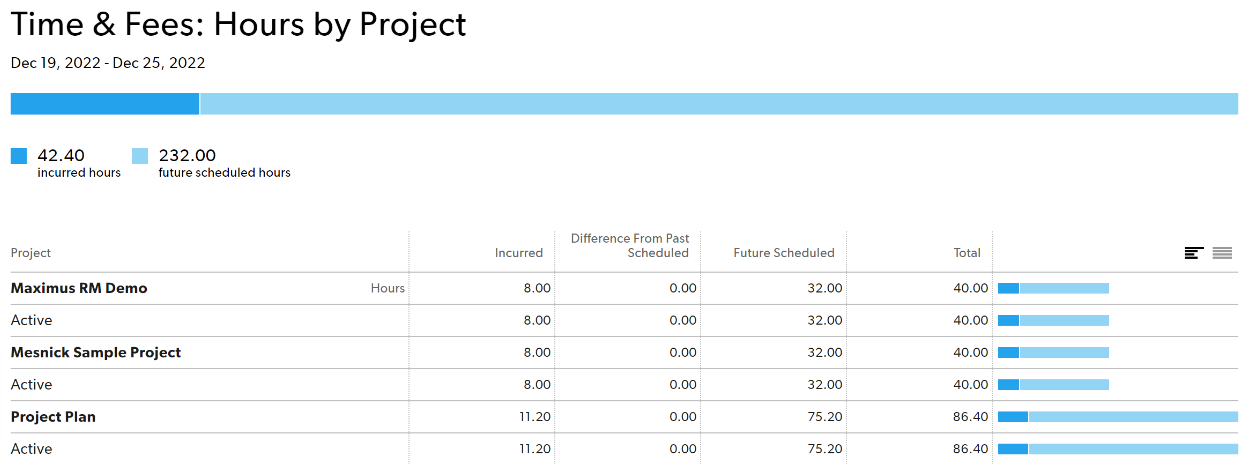
Time and fees reports columns:
- First column: selected groupings. Click a row to see individual time entries under each group.
- Incurred: actual amount already incurred on the project. Your account settings determine if this includes both confirmed and unconfirmed hours. Future time does not appear as incurred time on reports.
- Difference from past scheduled: Shows the difference between incurred time or money and the original plan. For example, if a person was originally scheduled to work on a project for four hours on a given day, but they confirmed five hours, difference from past scheduled column shows +1.
- Future scheduled: time or money scheduled in the future.
- Chart: incurred, difference, and future scheduled time for each row
Incurred, difference, and future scheduled time chart
You can display this chart in two ways.
- Rows relative to each other (different lengths), to visualize how the separate rows make up the whole.
- Rows are all the same length. This allows you to compare how the columns relate to each other per row.
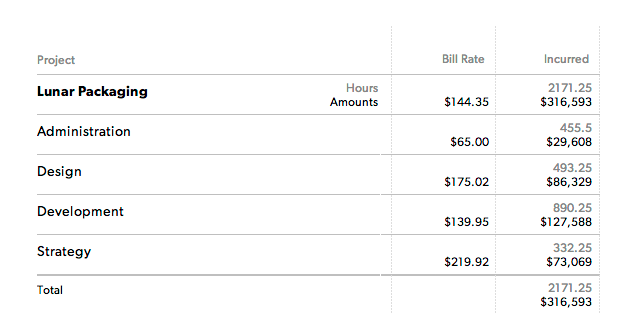
Bill rates
To see bill rates, include amounts when you set up your report.
The bill rate column shows a person’s applied bill rate for the hours worked on a project.
Sometimes reports show groups where multiple bill rates are included – for example, when grouping by discipline. In this case, the bill rate column calculates the average or effective bill rate for the work completed and scheduled in that group.
Filter your report by modifying any items under Show on the left sidebar.
Your team can create custom reports to monitor their scheduled and incurred hours. When the difference from past scheduled is close to zero as possible, everyone is working according to the original plan.
Create an expense report
Expense reports are included in budget reports. For example, costs incurred when hiring outside vendors, ordering prototypes, or travel costs.
View an expense report:
- Select Analytics, then New Report.
- On the right sidebar, select View, then Expenses.
Expense reports have six columns:
- Data available for the selected projects and groups. Click a row to see more details for that row.
- Incurred: Amount already expensed.
- Remaining: Amount still available for project expenses.
- Budget: Project expense budget. This number is set in project settings.
- Category: (not shown in image): Categories appear when you click on a group header. The expense category identifies the type of purchase, for example, travel.
- Notes: (not shown in image): A description of the expense.
About budget reports
Budget reports pull data for the project (not just time entries within the time frame) and give you a complete overview of the project status. You can view a budget report in hours, days, or amounts.
Budget reports set to amounts include time & fees and expenses. Reports only include budget information when a project has a budget for a specific item. For example, when a project has a budget for hours, this information will be included in a budget report for hours.
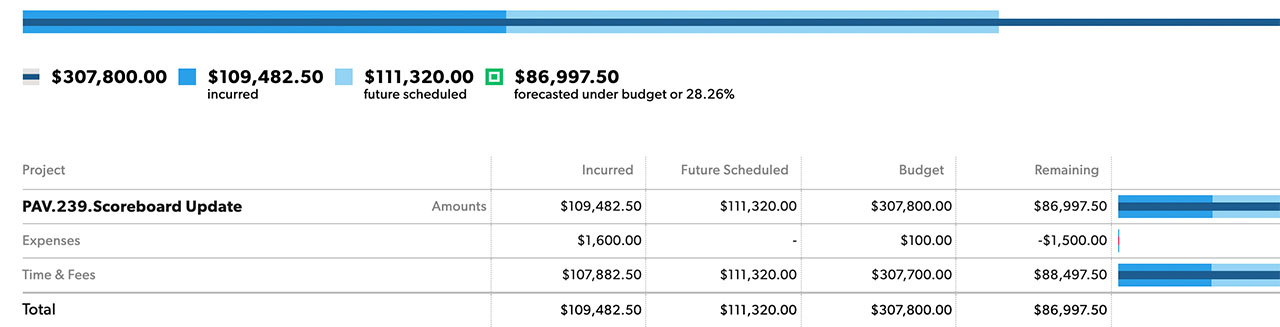
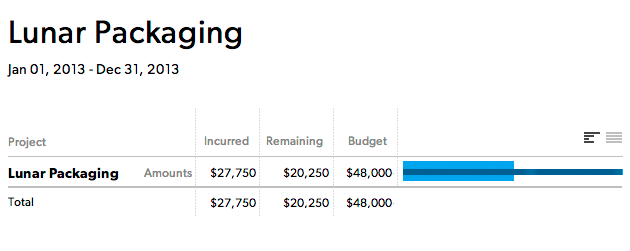
Budget reports include five columns:
- Project: Name of the selected groupings. Click the group name to see individual time entries or expenses.
- Incurred: Actual amount of time already worked or money expensed for the project. Expenses with a future date will still appear in the Incurred column because the money for the expense has already been set aside.
- Future Scheduled: The amount of time or money scheduled in the future.
- Budget: Project budget. It is a fixed amount predetermined in project settings.
- Remaining: The amount of time or money still available for the project.
Understanding budget reports
Budget reports include time entries for projects outside the time frame of the report. Budget reports always show the total budgets for projects that have any data within the time range you have selected. This means that even hours or amounts outside that date range will be included.
For example, if your time frame is January, but the project started in December and runs through March, your budget report includes data for the entire lifecycle of the project.
This is intentional, as budget reports are designed to give you a holistic, high-level overview of how your projects are tracking against their entire time/fee budget. Otherwise, your project might appear to be on track because you’re not counting hours for that time frame.
For example:
- Your project has a budget of $100K.
- You already spent $50K in time so you have $50K left to use. Resource Management always shows all time spent for the duration selected.
- If you change the date range to only include $25K worth of time, it would show $75K remaining even though the math would be incorrect.
If you only want to see hours for a selected time frame, switch to a time & fees report.
Create a utilization report
Utilization reports allow you to see historic utilizations based on incurred hours and forecasted utilization based on future scheduled assignments. The utilization rate is based on the availability of the person within that time frame.
To see a utilization report:
- Click Analytics and then click New Report.
- On the left sidebar, click View and then select Utilization.
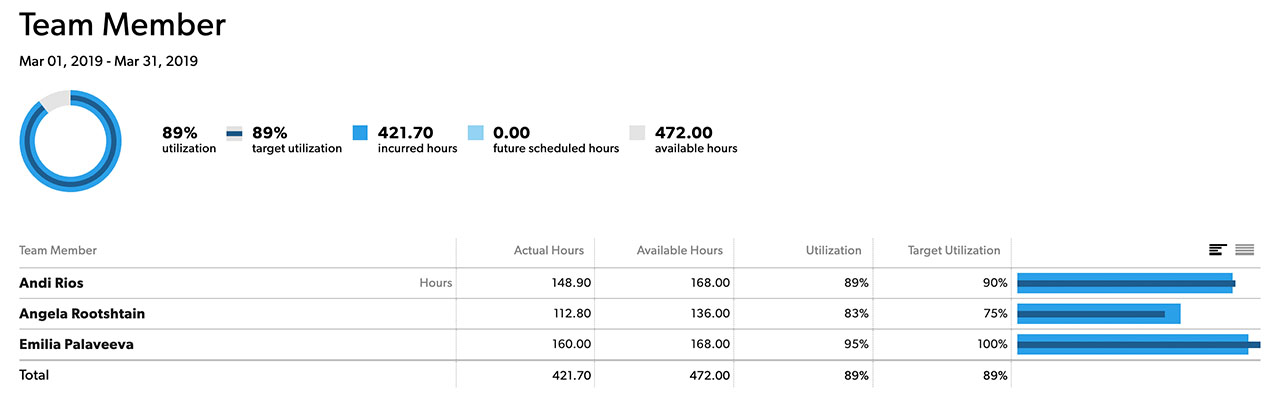
Utilization reports have five columns:
First column: The first grouping set for the report.
Actual hours: Either incurred (confirmed and unconfirmed) or future scheduled hours, depending on the time frame.
You may want to filter out non-billable hours. For example, you may want to omit internal projects, or only include time entries for a certain category. This only works when you are doing itemized time tracking for incurred entries.
Available hours: Standard availability as defined within Account Settings, for example, 8 hours/day.
Availability can be overruled by availability settings within a person's profile, for example, if someone is working part time. Employment dates, as set within a person's profile, also impact how availability is calculated. A person is only considered available between the first day of work and the last day of work as set in their profile settings.
Utilization: Utilization calculates actual hours divided by available hours, multiplied by 100%.
For example, if someone has 30 actual hours and 40 available hours, their utilization rate is 75%.
Target utilization: A fixed value set in each person’s profile. This number is used to track how utilization compares to targets for individuals or departments.
Create a leave report
- Go to Analytics. In the top right, click New Report.
- On the left sidebar under View, click Time & Fees and select Hours or Days.
- On the left sidebar under time frame, select a time frame: this year, this quarter, or a custom date range
- First group by Leave Type, then group by Team Member.
Hours in the report are grouped by project. You can filter on vacation days, sick leave or other leave types to get more refined results.
- On the left sidebar, under Show, click Leave Type.
- Select the checkboxes for leave (vacation, sick, parental etc) that you want to review.
You can also filter to see leave for only yourself, one person, or department using these filters.
Create a scheduled hours report
Reports won't show you scheduled hours per person within a project. However, you can export the data you need to create a pivot table to display this information.
To create a scheduled hours pivot table:
- Open the project you want to view the data from.
- On the left navigation panel of the project's page, click Time & Fees report.
- In the top right corner of the Time & Fees report, click Export and then click Export Underlying Data as CSV.
- Open the CSV in Excel. On the Insert menu, click Pivot Table. Accept the default values in the pop-up and click OK.
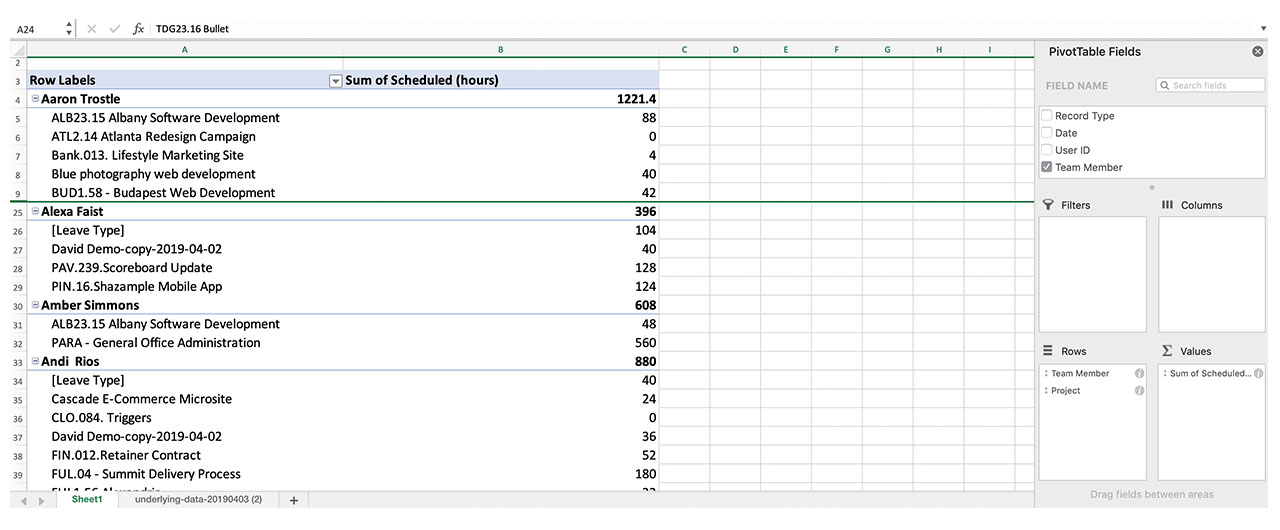
- In the PivotTable Field List, check project and team member to make them appear under Row Labels. Then check Scheduled (hours) to make sure it appears under values.
The table now shows the hours each person was scheduled for this project.