Applies to
Capabilities
Who can use this capability
Resourcing Administrators, Portfolio Editors, People Schedulers, Portfolio Reporters, and Project Editors can create reports.
Create time and fees reports
Time and fees reports show project progress and compares your actual time and fees to scheduled time and fees.
Time and fees reports pull data from your selected metrics: hours, days, amounts, amounts & hours, or amounts & days.
View a time and fees report:
- Select Analytics, then select New Report.
- On the right sidebar, click View, select Time & Fees, and then select a time frame.
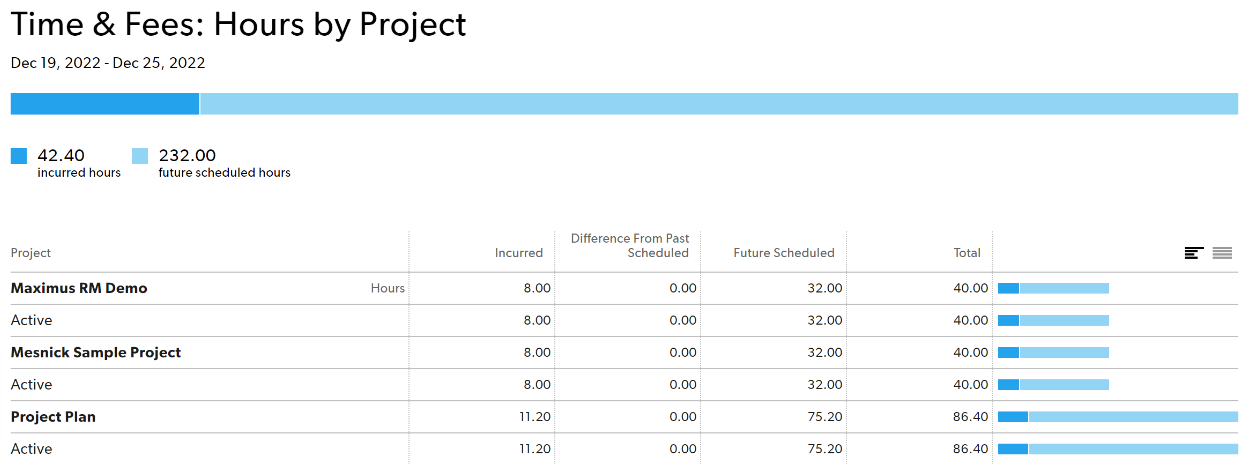
Time and fees reports columns:
- First column: selected groupings. Click a row to see individual time entries under each group.
- Incurred: actual amount already incurred on the project. Your account settings determine if this includes both confirmed and unconfirmed hours. Future time does not appear as incurred time on reports.
- Difference from past scheduled: Shows the difference between incurred time or money and the original plan. For example, if a person was originally scheduled to work on a project for four hours on a given day, but they confirmed five hours, difference from past scheduled column shows +1.
- Future scheduled: time or money scheduled in the future.
- Chart: incurred, difference, and future scheduled time for each row
Incurred, difference, and future scheduled time chart
You can display this chart in two ways.
- Rows relative to each other (different lengths), to visualize how the separate rows make up the whole.
- Rows are all the same length. This allows you to compare how the columns relate to each other per row.
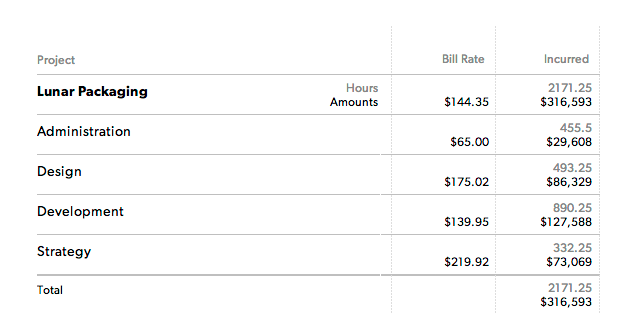
Bill rates
To see bill rates, include amounts when you set up your report.
The bill rate column shows a person’s applied bill rate for the hours worked on a project.
Sometimes reports show groups where multiple bill rates are included – for example, when grouping by discipline. In this case, the bill rate column calculates the average or effective bill rate for the work completed and scheduled in that group.
Filter your report by modifying any items under Show on the left sidebar.
Your team can create custom reports to monitor their scheduled and incurred hours. When the difference from past scheduled is close to zero as possible, everyone is working according to the original plan.